In March 2020 finally got the long-awaited ECU (Engine Control Unit) software update. Unfortunately it took a while to get a good chance to do some measurements to try to figure out what has been changed. So finally a few weeks back dusted the VCDS and collected all kind of intriguing data.
The subject of the title has been discussed a lot around the Forum. One of the first inspiring threads was

 www.t6forum.com
Measurement setup:
Data collected:
Picture - 1.
Recorded MFD Average consumption "1" readings at end of each 30 km trip. Just a note that some trips are missing here (e.g. #3, #4) as I did something else (#3 deviated from the route to fill up at 24 km, #4 a different route). However, all the data will be shown later on.
The actual MFD readings are plotted by the "blocks". To clarify somewhat Excel trendlines are plotted to bring out the “delta” between running uphill and downhill.
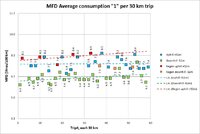
Too cluttered to my taste. I believe this is the phenomena described by many as “fickle mpg”.
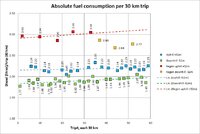
This is just accumulated fuel amount read from ECU. I’d like to say it’s much more clear now. The numbers by each “block” are litres (consumed over the 30 km trips).
Unfortunately I couldn’t fully control the weather, which probably can be used to explain some deviations in the plot and thus flatten the jittered graphs. E.g.:
Picture - 3.
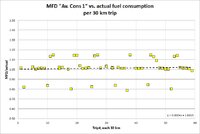
Relationship between absolute fuel consumption calculated from MFD "1" vs. fuel consumption reported by ECU. Again per the 30 km trips NOTE: missing trips 3,4 - see picture 4.
Picture - 4. FINAL PRODUCT.
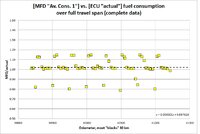
MFD smoothing algorithm of fuel consumption plotted over full travel span.
Now all data points (also the other trips not exactly 30 km as above) are included thus leftmost and rightmost points in the pictures above and below are the same.
Conclusions for my specific travel profile (mostly 30 km journeys).
Thank you for reading! Any thoughts, any clarifications needed, anything I missed or got wrong?
The subject of the title has been discussed a lot around the Forum. One of the first inspiring threads was

Fickle MPG
I thought I'd start a post about how much the MPG seems to vary... I've had my van, a 150 dsg kombi highline, for 2 months now and have covered 3250 miles in it. My trip to work is roughly a 75 mile round trip and consists motorway (75%), single/dual carriageway (20%) and town (5%) by distance...
Measurement setup:
- Vehicle: MY18 T6 DSG, CXEB engine, 4Motion. Mass approx. 2380 kg. Tyres 235/55-17.
- Daily journey in the morning 30.0 km from home to work – and the same back home in the afternoon after about 8 hour cooling period.
- Each journey consists of 10 km travelling 50-60 km/h + 20 kms in 80-90 km/h. Travel time 30+ minutes. Elevation difference between parking spots is 52 meters, so I lose a bit diesel on my way to work but fortunately reclaim the loss in the afternoon.
- DSG coasting OFF so could minimize use of brakes (=lost energy) and could better anticipate traffic.
- Battery was initially charged and then kept charged by alternator charging at 13.4 V (keeping cabin air blower at “2” which interestingly seems to prevent alternator going to “idle”). This was just to mitigate influence of engine drawing energy from the battery (which it does - almost 30 Amps = 400W).
- Noted down weather conditions, wind speed and direction, temperature, ambient air pressure, rain.
Conversion between litres/100 km and miles(UK)/gallon is: [mpg] = 282.5/[l/100km]
Data collected:
- MFD Average consumption "1".
- The unit I used was litres/100 km, so driving only 30 km and having on the MFD 8.0 L/100km would give 2.4 litres of fuel consumed.
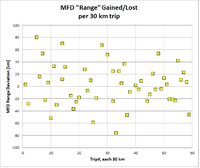
- MFD remaining "Range"
- ECU data. There are quite a few channels related to fuel consumption. For this the following were explored.
- ECU channel IDE00371 reports fuel consumption as litres/hour (naturally as ECU doesn’t really know the distance travelled as such). This data seems to be transmitted to MFD for further processing and display.
- ECU channel IDE01407 which reports accumulated fuel consumption over a DPF regeneration cycle.
- Along the above also other data were recorded: time stamps, vehicle speed, engine, revs, EGR status, exhaust temps, etc.
- Red = DPF regeneration took place travelling to work (DPF - Diesel Particulate Filter)
- Blue = Trip to work, +52 metres elevation delta
- Orange = DPF regeneration took place travelling to home.
- Green = Trip back home, -52 m elevation delta
Picture - 1.
Recorded MFD Average consumption "1" readings at end of each 30 km trip. Just a note that some trips are missing here (e.g. #3, #4) as I did something else (#3 deviated from the route to fill up at 24 km, #4 a different route). However, all the data will be shown later on.
The actual MFD readings are plotted by the "blocks". To clarify somewhat Excel trendlines are plotted to bring out the “delta” between running uphill and downhill.

Too cluttered to my taste. I believe this is the phenomena described by many as “fickle mpg”.
Picture - 2.
This is just accumulated fuel amount read from ECU. I’d like to say it’s much more clear now. The numbers by each “block” are litres (consumed over the 30 km trips).
Unfortunately I couldn’t fully control the weather, which probably can be used to explain some deviations in the plot and thus flatten the jittered graphs. E.g.:
- On trip#1 there was really strong tailwind, thus presumably gave me record low fuel consumption (green 1.77) 6.0 litres/100 km = 47.1 mpg.
- A lorry slowed me down (blue 2.05)
- Wet road (raining) (red 3.06), (red 3.04), (green 2.01), (green 2.00), (green 2.05), (blue 2.25)
- Exceptionally cold morning +4C (blue 2.33).
Picture - 3.
Relationship between absolute fuel consumption calculated from MFD "1" vs. fuel consumption reported by ECU. Again per the 30 km trips NOTE: missing trips 3,4 - see picture 4.

Picture - 4. FINAL PRODUCT.
MFD smoothing algorithm of fuel consumption plotted over full travel span.
Now all data points (also the other trips not exactly 30 km as above) are included thus leftmost and rightmost points in the pictures above and below are the same.

Conclusions for my specific travel profile (mostly 30 km journeys).
- During DPF regeneration MFD Average consumption "1" display is actually scaled down by approx. x 0.76. In the picture the “sampling rate” was 30 km, so the correction factor is a bit diluted because DPF regen lasts only approx. 20 km.
- Following the DPF regeneration next 60+ km MFD Average consumption "1" display is scaled up by x 1.14. Obviously this is to smooth out slightly elevated fuel consumption during the DPF regeneration over longer period – not to cause unnecessary concerns among Forum members.
- Fortunately the fickle fuel consumption on MFD is just an illusion (see real consumption in picture 2).
Note: DPF regeneration was split over two trips at about 40700 km, thus the correction is also split.
Thank you for reading! Any thoughts, any clarifications needed, anything I missed or got wrong?


 .
.