[T6_measured] 01-Engine - Built-in test for EGR

mmi

Senior Expert
VCDS User
Moderator
VIP Member
T6 Legend
So it seems - inevitable P0401.

Well, visited a VW garage to be tested - the van had accumulated 30 events in ECU's memory since July 2021 (since 20 months now). Eventually managed turn on the emission light at event number 31 - thus had a priviledge to have EGR flow tested. The result - pending - the ODIS went to an unending loop without a concluding result.

Meanwhile, I think I have reproduced the EGR flow test using VCDS. However, I don't have any reference value to estimate the degree of EGR cooler blockage. Neither did ODIS tell the reference value (should have told but the computer said no) - thus the final test is still pending.

Dear Forum members, I would appreciate if members equipped with VCDS could run the T6 engine's built-in test for EGR and post the result files here for future reference. I'm more than happy to provide the graphs in return. The more the merrier! :thumbsup:

@Dellmassive - I'm intrigued to see how the new EGR performs!


How to:​

General conditions​

  • Download the attached measurement setup file TEST_EGR_DPF_FLOW.u01 - remove the .PDF extension so it will become a VCDS compatible .u01 file
    • Alternatively can also tick the parameters individually as on screen captures further down

  • Proceed as below - preferably immediately after a (minimum of 15 minute) drive so everything is warmed up - for comparable results.
  • Before coming to halt switch off Stop/Start and turn off AC .
  • Let engine idle
  • == Unfortunately can't proceed if DPF regeneration is in progress ==


(1) Create engine blockmap data file​

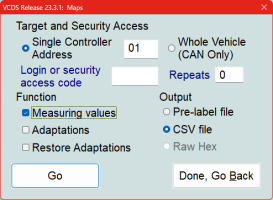
  • VCDS > Applications > Controller Channel Map >​

    • VCDS_controller_map.png
  • Tick the boxes as above and click Go
  • VCDS flashes screen for approx. two minutes. When finished click Done, Go Back


(2) Run engine's built-in EGR flow test​

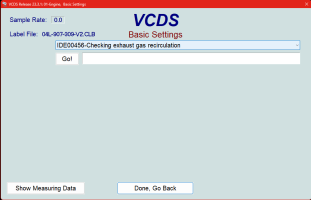
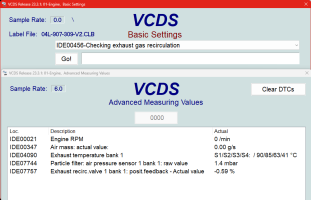
  • VCDS > Select > Engine > Basic Settings
  • Select - Show Measuring Data
  • VCDS_01-04-Basic_Settings_b.png
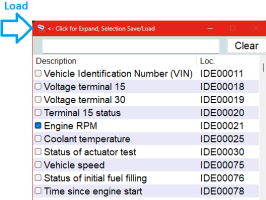
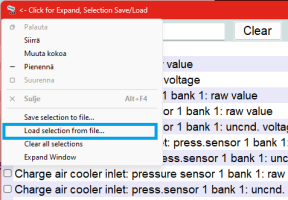
  • Load measurement setup file TEST_EGR_DPF_FLOW.u01 (Load selection from file)
  • EGR-test-Load_Select_Adv_Meas_Values_a.png
    VCDS_01-04-Load_file_a.png
  • v_11.png
  • Click Log , enter file name
  • Click Start (VERY IMPORTANT STEP!!)
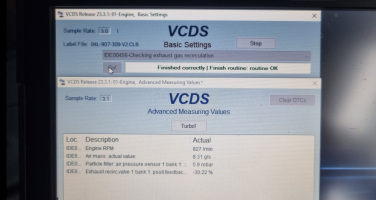
  • Select IDE00456-Checking exhaust gas recirculation (from pull-down menu if not shown)
  • Click Go!
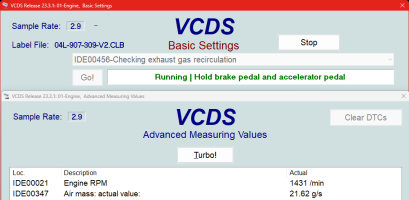
  • Proceed as instructed on screen (Hold brake pedal and accelerator pedal) - test runs 60 seconds
  • EGR-TEST-2-running_a.png
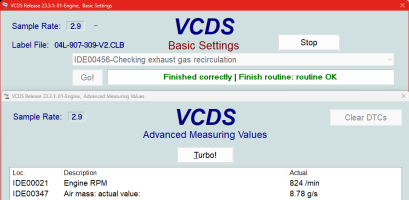
  • When finished make a note of the message and let logging run for another 15 seconds
  • EGR-TEST-3-Finished_correctly_a.png
  • Stop (the data logging)
  • Done, close
  • Back out from Basic Settings, Close controller, etc. exit VCDS
  • Switch off the engine, etc.
EDIT (2023-04-26) Added parameter IDE04090 Exhaust temperature bank 1 into measurement setup to capture DPF conditions more accurately. Thus the screenshots are slightly different. Could compensate the extra parameter by clicking on "Turbo" button.

(3) Please post the logs (2 files)​


  • The log files (2 of them) are in folder C:\Ross-Tech\VCDS\Logs\...
  • The file Blockmap-01...CSV is a package of approx 1500 engine parameters - for further and possibly future evaluation of the test (e.g blockage vs. mileage vs. DPF ash accumulation)
    • Besides the above the collecting the above at (1) lets engine and exhaust temperatures stabilise so can be compared with others recorded similarly
  • The actual log file LOG-01-.....CSV (or named by you) contains timestamped measured values.
  • The particle filter air pressure sensor here is a kind of extra bit - a try to evaluate DPF condition as it's pressure loss is measured controlled way - though needs to be compared with soot and ash masses at the moment of testing (these are found in blockmap).

Thank you very much in advance!​


Other related threads​

EDIT 17.3.2024:​

EGR valve test procedure - actual vs. requested EGR valve position​

Possibly related fault: P046C​
 

Attachments

  • TEST_EGR_DPF_FLOW.u01.PDF
    50 bytes · Views: 22
Last edited:
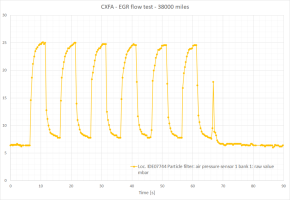
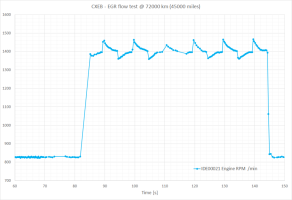
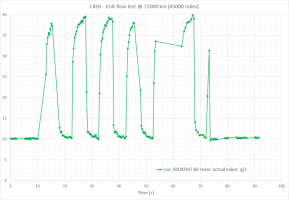
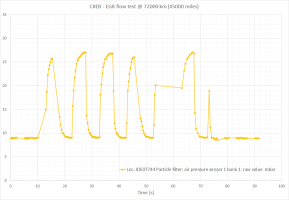
An appetiser for now.
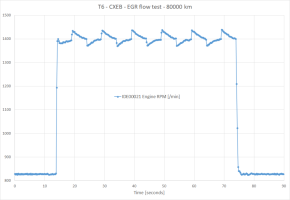
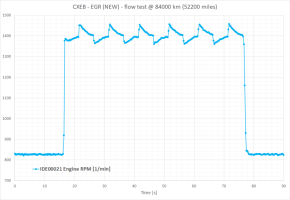
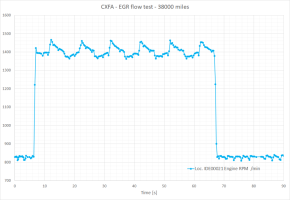
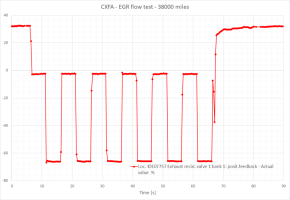
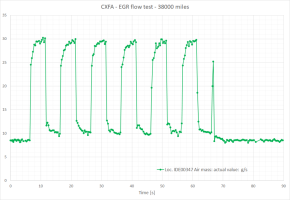
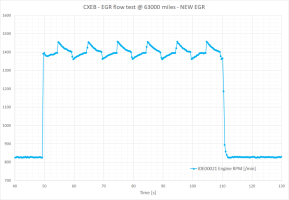
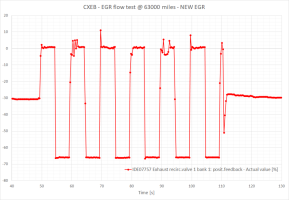
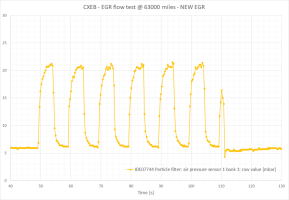
The result plots will be a scaled/syncronized combination of these now below separate graphs. Quite an interesting RPM pattern :grin bounce:

1682277084555.png

1682277103654.png
1682456568912.png


1682277119347.png
 
Last edited:
EDIT: post added 18.5.2023.

"Thermal windows"​

VW note B0A6 - Transaction No.: 2067703/4​

According to the new judgements of the European Court of Justice (ECJ) it appears that the so-called “thermal windows” may no longer be permitted in certain areas.
The thermal window describes the outside temperature-dependent regulation of the exhaust gas recirculation.
A solution is in preparation for the affected vehicles (T6). We will contact you as soon as it is available.
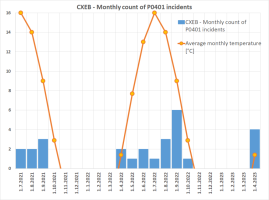
Well, regarding the temperature-dependant EGR operation - monthly occurencies of P0401 faults plotted below - as well as monthly average temperatures in Finland.

1684433845392.png

Interestingly the winter months were fault free - actually the fault was never triggered below +14 °C (logged air intake temperatures at every fault).
 
Last edited:
EDIT: post added 18.5.2023

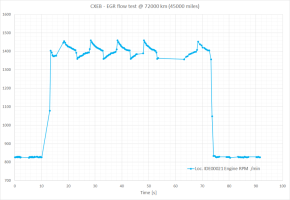
(1) RPM during the test - commanded by the ECU​

1684435656692.png

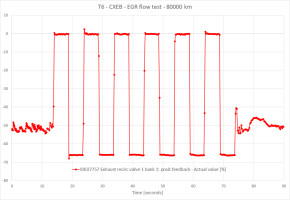
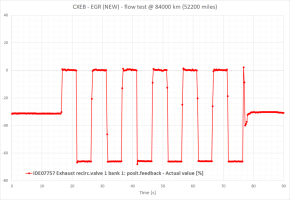
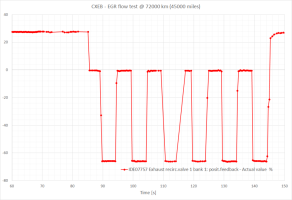
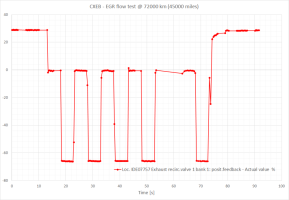
(2) EGR valve position during the test - cycles from 0% (no recirculation) to -65% (max recirc at the test)​

1684435678338.png

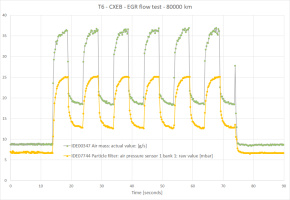
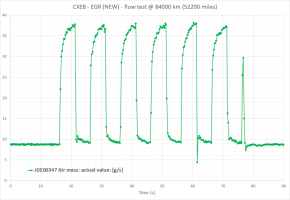
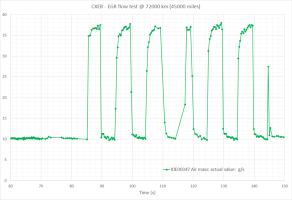
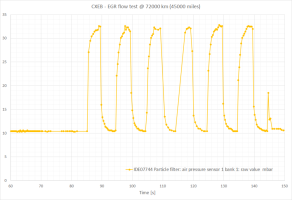
(3) Intake air flow during the test​

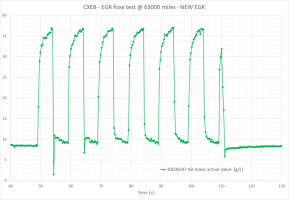
The maximum is full flow (no recirculation). Minimum shows EGR's capability to direct exhaust back to combustion - the less fresh air the better.

Also included calculated HIGH/LOW ratio - which presumably indicates how clogged the EGR cooler is.

1684435783863.png
1684435698938.png

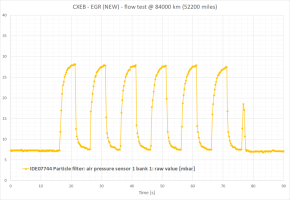
(4) Pressure loss over DPF during the test​

Needs further evaluation and reference tests how to extract DPF condition from this. Anyways, the "standardised" value would be the maximum because the minimum is affected by EGR cooler blockage.
1684435967764.png


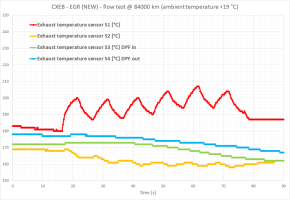
(5) Exhaust temperature during the test​

Average DPF temperature (S3, S4) during the test was 170 °C. The engine and exhaust were preheated by 30 km drive, engine was not stopped during preparations (VCDS hook-up) for the test. The DPF temperature affects siginificantly to pressure loss.


1684437036217.png
 
Last edited:
Sure. I'll try and get some data for you tomorrow.
 
  • Love
Reactions: mmi
Hi @mmi I hope I've done it right?
 

Attachments

  • blockmap-01-04L-906-056-KH_WV2ZZZ7HZHH093570-20230424-1507.CSV
    126.5 KB · Views: 7
  • LOG-01-IDE00021_&3.CSV
    20.1 KB · Views: 6
  • Like
Reactions: mmi
2018 CXEB @72000km
 

Attachments

  • 20230424-n10n-blockmap-01.csv
    131 KB · Views: 4
  • 20230424-n10n-egr-test-values.csv
    28.4 KB · Views: 12
2018
CXEB 204
63k miles
(NEW EGR/Cooler last month)


...


Blockmap & Log attached.


....


VCDS sign off after test:


1682356054775.png


+++++++++++


@mmi time for you to do your expert graphs and analysis.


.
 

Attachments

  • LOG-01-IDE00021_&3_dell_EGR.CSV
    33.5 KB · Views: 7
  • blockmap-01-04L-906-056-KQ_WV1ZZZ7HZJH096679-20230424-1723.CSV
    127 KB · Views: 5
  • Like
Reactions: mmi
2018 CXEB @72000km

The previous one was right on the verge of regen, so here's another one taken after it completed and some miles covered.
 

Attachments

  • 20230425-n10n-egr-test-values-after-regen.csv
    12.3 KB · Views: 6
Hi @mmi I hope I've done it right?
Thank you very much. Attached the data plotted.

(1) RPM during the test​


1682446782291.png

(2) EGR valve position during the test - cycles from 0% (no recirculation) to -65% (max recirc at the test)​

1682446960229.png

The EGR normally runs both positive and negative values - yours was on positive side before the test.

(3) Intake air flow during the test​

The maximum is full flow (no recirculation). Minimum shows EGR's capability to direct exhaust back to combustion - the less fresh air the better.

Also included calculated HIGH/LOW ratio - which presumably indicates how clogged EGR cooler is. Higher the ratio the better. Mine is already down to 1.8 - assuming it's at the point needing attention because throwing P0401 code every now and then.

1682447716914.png
The values are averages of the highs and lows during the test.

1682447406509.png

(4) Pressure loss over DPF during the test​

Needs further evaluation and reference tests how to extract DPF condition from this. Anyways, the "standardised" value would be the maximum because the minimum is affected by EGR cooler blockage. Perhaps another measurement in 6-12 months?

1682447657733.png
 
2018 CXEB @72000km
Thank you very much. Plots below - both just before DPF regen and after.

Before DPF regen​

(1) RPM during the test​

1682453117387.png

(2) EGR valve position during the test - cycles from 0% (no recirculation) to -65% (max recirc at the test)​

1682453125316.png

(3) Intake air flow during the test​

1682453192383.png

1682453140421.png

(4) Pressure loss over DPF during the test​


1682453152260.png


After DPF regen​

(1) RPM during the test​

1682453382218.png

Hmm... there is a 10 second gap in the data - from 53 to 63 seconds - one cycle lost

(2) EGR valve position during the test - cycles from 0% (no recirculation) to -65% (max recirc at the test)​

1682453396669.png


(3) Intake air flow during the test​

1682453519995.png

1682453411911.png


(4) Pressure loss over DPF during the test​


1682453463524.png

Is the EGR still the original one? Flushed?
 
2018
CXEB 204
63k miles
(NEW EGR/Cooler last month)
Thank you very much - the data from a new shiny EGR is definitely essential to evaluate condition of older ones :thumbsup:

(1) RPM during the test​

1682455354751.png

(2) EGR valve position during the test - cycles from 0% (no recirculation) to -65% (max recirc at the test)​

1682455372651.png

(3) Intake air flow during the test​

The maximum is full flow (no recirculation). Minimum shows EGR's capability to direct exhaust back to combustion - the less fresh air the better.

Also included calculated HIGH/LOW ratio - which presumably indicates how clogged EGR cooler is. Higher the ratio the better. Mine is already down to 1.8 - assuming it's at the point needing attention because throwing P0401 code every now and then.

1682455402553.png

The values above are averages of the highs and lows during the test.

1682455423435.png

(4) Pressure loss over DPF during the test​

1682455449473.png
 
Thanks, something to think about!

Hmm... there is a 10 second gap in the data - from 53 to 63 seconds - one cycle lost

Most likely the data quality issues would be attributable to my crappy 4g wifi router, I used Hex-Net over wifi… good to know, will use cable next time :thumbsup:

Is the EGR still the original one? Flushed?
Original EGR and not flushed as far as I know, and I’ve owned the vehicle for 42000km.
 
Last edited:
Original EGR and not flushed as far as I know, and I’ve owned the vehicle for 42000km.

I do >90% motorways / b-roads and minimal urban or city driving. Also I use additives, Redline RL-2 as most recently with every filling. The intention has been to keep injectors clean mostly and I don’t know if it has anything to do with the apparent good EGR condition… this is not an advertisement. Overall I tend to not drive sparingly but honestly smashing down motorways 90% of time I don’t think the driving style matters much in the remaining 10%.

As for why I posted after regen I took a cursory peek on the data before graphed out and noticed the DPF pressure was high in my first sample, probably indicative of DPF resisting the flow more right before regen - thought this might be interesting.

Before:
1682483837986.png

After:
1682483892850.png
 
Last edited:
As for why I posted after regen I took a cursory peek on the data before graphed out and noticed the DPF pressure was high in my first sample, probably indicative of DPF resisting the flow more right before regen - thought this might be interesting.
Well spotted - and thanks for sharing.

I seem to have created a habit recording almost the same as above at different phases of DPF regen cycle by letting engine idle 15 seconds before switching off. I do see similar behaviour - more soot, higher pressure. However, DPF temperature seems to play very significant role in DPF pressure loss (hot DPF = more pressure loss) - thus also those need to be accounted for.

Anyways, just edited the "instructions" and replaced the VCDS .u01-file with another one which will now record also DPF input and output temperatures - parameter IDE04090 Exhaust temperature bank 1 - actually will record all four exhaust temperature sensors. Let's see how it pans out.

I think we could use this setup also to verify DPF pressure sensor data validity as the ratio of pressure high/low is quite close to air flow high/low ratio :geek:
 
I think we could use this setup also to verify DPF pressure sensor data validity as the ratio of pressure high/low is quite close to air flow high/low ratio :geek:

Nice idea, I like it! :thumbsup:

As you say at the very least might help out in differentiating partial sensor failures from real blockages / leaks
 
However, DPF temperature seems to play very significant role in DPF pressure loss (hot DPF = more pressure loss) - thus also those need to be accounted for.

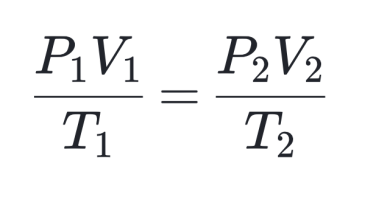
Just a shower thought but I wonder if the temperature effect could be approximated by the ideal gas law? Like, if in two different measurements the volume is equal but temperature is higher in one of them, the pressure must also be higher.

1682539521708.png
 
Last edited:

"Thermal windows"​

VW note B0A6 - Transaction No.: 2067703/4​
According to the new judgements of the European Court of Justice (ECJ) it appears that the so-called “thermal windows” may no longer be permitted in certain areas.
The thermal window describes the outside temperature-dependent regulation of the exhaust gas recirculation.
A solution is in preparation for the affected vehicles (T6). We will contact you as soon as it is available.


"The ECJ has now ruled (Case C-134/29): Thermal windows are not permitted under European law and are therefore illegal. The use of the window violates European environmental regulations with regard to newly registered motor vehicles."

Remains to be seen but maybe concerns new vehicles only. I wonder what the effect would be if the removal of thermal windows was forced upon existing vehicles through a recall and/or checked in MOT.
 
Back
Top