EGR Valve Self Test Procedure (IDE00242)- P046C?

Cuiken

Senior Member
VIP Member
T6 Guru
So, I've been getting the all too common P046C fault code along with P2457 (Insufficient EGR Cooling Performance). Neither alone will flag a check engine light but combined they sometimes seem to. To try to figure out what is going on, I ran an EGR Flow test on VCDS using instruction from @mmi on this rather excellent page:


I didn't spot much relating to the EGR funtion but the EGR valve reading itself was interesting. Basically, it didn't appear to be fully closing.

My confidence with VCDS growing, I went on to run the IDE00242-EGR Valve Output Test. My results suggested that the value requested by the ECU didn't match the Actual value returened by the EGR Valve for some values and that, occasionally, it appeared to become 'stuck'. Problem is that I don't have any reference for what a 'healthy' EGR Valve does during this test.

Below is the sequence needed to run the IDE00242 test. It's one of the easier checks to run. If you have a VCDS system yourself (and a spare 20 minutes) I'd be really interested to see your results.

How to:

General conditions

  • Proceed as below - Test can be run with the engine running or switched off (ignition on). If you can do both, all the better.
  • == Unfortunately can't proceed if DPF regeneration is in progress ==

(1) Create engine blockmap data file​

  • VCDS > Applications > Controller Channel Map >​

    • VCDS_controller_map.png
  • Tick the boxes as above and click Go
  • VCDS flashes screen for approx. two minutes. When finished click Done, Go Back


(2) Run engine's built-in EGR Valve test​

  • VCDS > Select > Engine > Output Tests
  • In the drop down menu, select IDE00242
  • Select - Show Measuring Data
  • From the list of measurements (tickbox list), select the tickbox for IDE07756 and IDE07757 - These ar the Requested, and Actual EGR Valve values
  • Click Log , enter file name
  • Click Start (VERY IMPORTANT STEP!!)
  • Below IDE00242 (from pull-down menu if not shown), click Start
  • Software will now move the EGR valve through a range of values and measure both the Requested and Actual Valve positions (% of open)
  • During the test the main window will simply show "Running" but the live measurement data will be dispayed in the measurements window.
  • The test take a couple of minutes to run and ends in a Timeout (displayed in main window)
  • When finished make a note of the message and let logging run for another 15 seconds
  • Stop (the data logging)
  • Done, close
  • Back out from Basic Settings, Close controller, etc. exit VCDS
  • Switch off the engine (if running) etc.

(3) Please post the logs (2 files)​

  • The log files (2 of them) are in folder C:\Ross-Tech\VCDS\Logs\...
  • The file Blockmap-01...CSV is a package of approx 1500 engine parameters - for further and possibly future evaluation of the test (e.g blockage vs. mileage vs. DPF ash accumulation)
    • Besides the above the collecting the above at (1) lets engine and exhaust temperatures stabilise so can be compared with others recorded similarly
  • The actual log file LOG-01-.....CSV (or named by you) contains timestamped measured values.

Results:
Results from my own van ended uplooking like this (once plotted in excell). Orange is Actual Valve position, Blue is requested.

Engine not Running.

The first test showed an initial period where the Actual failed to match the Requested but it sorted itself out mid test.

1693858056651.png


The second and third tests showed reasonable matching between Requested and Actual but with a bit of 'noise' on the actual value.

1693858088359.png


1693858112199.png


Engine Running:

The fourth test was run with the engine running and the result matched that from the EGR flow test with the valve failing to hit the +5% Requested value.

1693858137799.png


Engine Switched Back Off:

The fifth and sixth tests were then run with the engine switched off again and both showed significant difference between Requested and Actual.

1693858150044.png


1693858249076.png


Observations on my own data:

  1. The 'at rest' position' of the valve is not Zero. For tests #1, #2, #3, #5 and #6 where the engine was not running, the initial value from the EGR valve is about -10% so slightly open.
  2. In the one test I ran where the engine was running, the valve never manages to completely close. I have also noticed (through experimentation) that the higher the engine RPM the wider open the valve becomes during the test. In the graph below, for example, I highlight the point in the test where engine RPM changes from 800rpm to 1400rpm. The Requested valve postion does not change but the Actual position opens from around -1% to around -5%1693905982436.png
  3. Most obviously, my EGR valve does not track Requested position particularly well, especially close to 0% and after a large negative to positive swing.
  4. After running the test a couple of times I captured results #2 and #3 which look relatively clean. I wonder if I'd simply freed up the valve?
  5. After then running the engine for a while (during test #4), the valve reverted to it's previous (bad) behaviour in tests #5 and #6.

To my mind, it looks like my EGR valve is simply clogged up and the actuator is no longer working as it should. This would certainly explain the P046C 'implausible signal' fault description. Only problem is that I have no data to compare against. Like I say, if anyone could take a look at this test themselves and post data, I'd be very grateful.
 
Last edited:
Here you go!
 

Attachments

  • 2023-09-05-n10n-blockmap-01-engine-not-running.csv
    131 KB · Views: 25
  • 2023-09-05-n10n-blockmap-01-engine-running.csv
    131.1 KB · Views: 6
  • 2023-09-05-n10n-cxeb-egr-test-engine-not-running.csv
    36.1 KB · Views: 6
  • 2023-09-05-n10n-cxeb-egr-test-engine-running.csv
    34.9 KB · Views: 7
You absolute legend! Thanks for doing this so quickly.

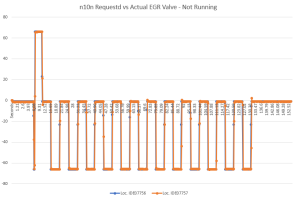
Quickly graphed the results and they look very different:

Not Running
1693935669159.png


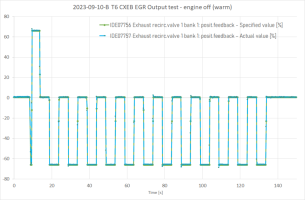
Running
1693935601935.png


In summary, near perfect tracking of Requested and Actual values across whole range and with engine both off and running.

Curious as to why the runing test runs from +66 to 0 rather than -66 to 0 in my test but maybe it just chooses polarity based on the starting value?

Either way, definitely suggests to me that my EGR is goosed. Not ideal but at least might explain the engine light etc.

Thanks again!
 
Last edited:
BTW, were the instructions okay? I wrote them out in part from memory.
 
Curious as to why the runing test runs from +66 to 0 rather than -66 to 0 in my test but maybe it just chooses polarity based on the starting value?
I don’t know. The polarity is an unsolved mystery, probably would require to look at the valve with egr in hand to understand if and how it affects the valve movement.

BTW, were the instructions okay? I wrote them out in part from memory.

Perfect! The only small things really were that #1 the tests end in timeout and #2 during tests values are shown only in the selected measuring values box, ie the main test window just shows ”Running” and that’s it

Either way, definitely suggests to me that my EGR is goosed. Not ideal but at least might explain the engine light etc.
Yeah, sounds like the valve sticks and cannot move freely all the time
 
The only small things really were that #1 the tests end in timeout and #2 during tests values are shown only in the selected measuring values box, ie the main test window just shows ”Running” and that’s it

Thanks, I'll add that to the instructions.

If anyone else has time to run this test it'd be great to have a bit more data.
 
  • Like
Reactions: mmi

New EGR.​

The curves overlap nicely.

1694358958683.png

Curious as to why the runing test runs from +66 to 0 rather than -66 to 0 in my test but maybe it just chooses polarity based on the starting value?
don’t know. The polarity is an unsolved mystery, probably would require to look at the valve with egr in hand to understand if and how it affects the valve movement.
Was the engine cold, and the test was the first thing after start-up?

Below mine - engine was almost at normal temperature when started.
Also the curves overlap almost perfectly.

1694359096922.png


I'm wondering if this positive/negative is the same as seen below from thread below.
After "cold" start EGR seems to stay some time on positive side.

1694359297326.png
 

New EGR.​

The curves overlap nicely.
Congratulations! Looks nice!

Was the engine cold, and the test was the first thing after start-up?
Not sure if you asked @Cuiken or me but engine was hot in my measurements, took the running measurements without ever turning it off after a one hour drive

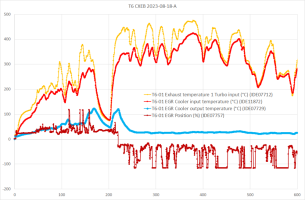
After "cold" start EGR seems to stay some time on positive side.
Is this systematic? That is, enough samples to know it’s always like that?
 
Well, a log from February - same route - but the old EGR cooler.

So, positive start and never changes polarity in that one.

I added IDE07757 to my always recorded set, replacing IDE07754 - should get a bunch of "cold start" samples in the next couple of weeks.
 
So, positive start and never changes polarity in that one.

I added IDE07757 to my always recorded set, replacing IDE07754 - should get a bunch of "cold start" samples in the next couple of weeks.

Oh btw, not that it necessarily matters much but I think there's a misinterpretation in VCDS regarding IDE07754 IDE07757. To get matching results from CAN sniffing and DBC file I need to treat the value as 15-bit signed integer and divide the raw CAN value by 50. Still, this produces percentages > 100% which doesn't really make much sense.

Code:
    SG_ IDE07757_egr_valve_position m6440042 : 39|15@0- (0.02,0) [0|100] "%" 0x62446A

Almost all of the other values have either 0.1 or 0.01 multipliers and are happy with 16 bit values so this somewhat stands out. My thinking is that the high bit might not be a sign but some kind of feature flag like "up to temperature", "extra cooling requested" or something along those lines.

Sample size 1 but indeed today started as positive and then flipped over to negative little bit later on, only checked now to get DBC right ;)

Code:
timestamps,CAN3.advanced_measuring_values_engine.IDE07757_egr_valve_position
0.0,24.399999618530273
0.8001,24.479999542236328
1.2001,24.559999465942383
2.0002,24.399999618530273
...
82.7756,52.599998474121094
83.17514999999999,43.34000015258789
83.5752,34.70000076293945
83.975,-5.760000228881836
84.37485,-40.459999084472656
85.17445,-31.5
85.57424999999999,-37.65999984741211
...

EDIT: fixed typo IDE07754 -> IDE07757
 

Attachments

  • IDE07757.ChannelGroup_0_CAN3_-_message_advanced_measuring_values_engine_0xE8.csv
    45.7 KB · Views: 3
Last edited:
Oh btw, not that it necessarily matters much but I think there's a misinterpretation in VCDS regarding IDE07754. To get matching results from CAN sniffing and DBC file I need to treat the value as 15-bit signed integer and divide the raw CAN value by 50. Still, this produces percentages > 100% which doesn't really make much sense.
Yes, have to say I'm not sure what IDE07754 means. It seems to be in synch with IDE07756 although does not produce as nice square wave as the others, Interestingly in the test it maxed out exactly at -100/+100 - not many samples though.

1694418001214.png
 
Yes, have to say I'm not sure what IDE07754 means.

Ah damn I made a typo, meant IDE07757 with > 100% remark and the need to use 15-bit signed in order to match VCDS. Apologies for the confusion, edited.

Like in my above csv the position goes to about -118% and looks like yours has the same issue overshooting:

1694419384678.png
 
Last edited:
Ta for all the results. Clerarly a working EGR looks nothing like the values I've been getting.

My van is booked in for a new EGR this week.

FYI, my results were all collected with a warm engine (after a 30 minute drive).

Once I've got the new EGR I'll retest and post an update.

Ta again for all the assistance.
 
Sorry about blabbering... but here's some more material about IDE07757 over longish drives:

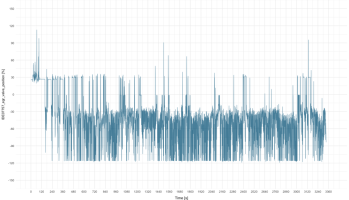
1. No regen

After the short positive period IDE07757 stays mostly negative. What I find interesting, by looking at the basic stats, is that both average and median sit right about at -45 :geek:. Coincidence?

This was "cold start" and for a large part motorway running with some city driving near start and b-roads at the end.

Code:
CAN3.advanced_measuring_values_engine.IDE07757_egr_valve_position
unit  count   ts_0      ts_n   val_0    val_n       min      max      avg   median  std_dev
   %   7206 2.3779 3334.5379 25.8800 -83.6200 -119.0600 112.8600 -45.4190 -44.2600  40.4367

1694448130139.png

2. Regen

During regen, IDE07757 stays mostly at zero. To me that's logical as ECU pushes hot and partly unburned exhaust to DPF. Average and median are distorted a lot due to the regen section, but interestingly deviation still is pretty close to driving without regen. This was a hot start, followed by motorway driving and ending with urban driving in a morning rush from about 2400s onwards.

Code:
CAN3.advanced_measuring_values_engine.IDE07757_egr_valve_position
unit  count   ts_0      ts_n   val_0   val_n       min      max      avg  median  std_dev
   %   7900 2.3904 3631.9058 24.8200 27.6400 -118.1000 114.0200 -16.2238 -1.2400  37.9890

1694448609237.png

I'm basically none the wiser after looking at these but it's very clear there's more to this metric than meets the eye - the unit as percentages just doesn't really make much sense.
 
New EGR Results - Puzzling
We had a new EGR and pipework fitted yesterday.

Checking the full EGR self test (see below) it looks to have resolved our issue where the valve never fully closed when the engine is running.
On the other hand, the results I get from the dedicated EGR Valve Test (IDE00242) look far less improved.
During the test, the first couple of negative to positive transitions look pretty messed up. After that, it settles down fine and subsequent transitions are nice and crisp. Additionallly, the requested value is now 0% rather than +5% in previous tests. So some improvement but still confusing:
1694680592600.png


Just very puzzled about how/why these results don't match other 'healthy' vans.
I guess I'll need to wait and see if the fault codesz remain clear. Really hoping I've not blown £1300 for nothing :oops:
 
Really weird indeed, especially considering it looked totally ok during IDE00456 in the other thread.

As you say, some definite improvements in the valve closing. That should help to not push sooty / partially unburned exhaust gas through the EGR during regeneration, that would probably be a fast pass to EGR failure. So I don't think changing the EGR was wasted.

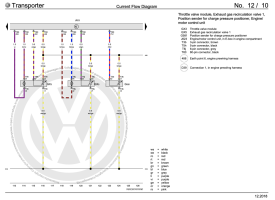
Above response looks worrying though. Looking at the wiring diagram the position sensor of the EGR valve is supposed to be just a potentiometer (AD conversion at ECU). Since the EGR is brand new and unlikely to be faulty I would suspect an intermittent wiring or contact fault or in the worst case a fault within ECU itself. If it's a wiring fault I suppose it could be either in to the valve control motor or the position sensor - both could result in ECU seeing it as incorrect position.

That's the best I can think of - maybe there's other explanations. I was considering if there would be some kind of learning / adaptation with EGR so that it would take a bit of time to get stars aligned but I just don't know enough to comment on that.

1694687159172.png
 
Last edited:
Thanks for the wiring diagram.

I do find the issue confusing. My initial thinking was, as you say, wiring, AD or DA failure in the ECU (voltage sent to EGR could be at fault rather than returned value).

On the other hand though, the failure always happens at the same point in the test (just after the large positive excursion) before sorting itself out. This is true both befopre and after the EGR replacement. It's hard to think how an intermittent silicon/contact/wiring error would cause such a repeatable result.

I guess I'll just need to watch it for fault codes and see how it goes.

I lost the log but I did also catch a log where I ran this test with the engine running. In that case, everything looked good.
 
On the other hand though, the failure always happens at the same point in the test (just after the large positive excursion) before sorting itself out. This is true both befopre and after the EGR replacement. It's hard to think how an intermittent silicon/contact/wiring error would cause such a repeatable result.
Yes, I agree

I lost the log but I did also catch a log where I ran this test with the engine running. In that case, everything looked good.

Well, if this never happens engine running no problem, right? So, I would try to run the test quite often, daily, with engine running cold hot etc until I gained confidence there’s no problem.

Could this be just a software glitch? I see your ECU software is different to mine

Code:
Address 01: Engine (J623-CXEB)       Labels:. 04L-907-309-V2.clb
   Part No SW: 04L 906 056 AF    HW: 04L 907 445 A
   Component: R4 2.0l BTD   H03 6207
   Revision: 23101001 
   Coding: 0025401CC33601080000

One more thought: if you have a carista or some other decent OBD dongle I would set up a dashboard to graph IDE07756 and IDE07757 either from Car Scanner (iOS, Android) or Torque (Android). That way you could see them on the phone during driving and maybe catch if there’s any discrepancies, no good to run VCDS all the time. If this sounds like something you would like to pursue, I can help with iOS settings, have to rely on @mmi regarding Android ;). No guarantees though - we know the required settings for CXEB but can’t be sure same settings work with your ECU software version as it’s different
 
Last edited:
Back
Top