VW T6 Custom PID codes for DPF

I used to be involved in the software design of these. Never did anything on VW, but did work with several other manufacturers. They all work in a similar way though.
Thank you very much for the insight @aferris2, much appreciated!

As the ECU's are usually supplied by the likes of Bosch, Delphi etc it is no wonder they are similar between vehicle brands. After all, R&D is expensive and there's a limited set of sensor and actuator types to work with so it would be total waste to completely redesign the platforms for each brand.

These counters make it much easier to process continual accumulation of various things (in addition to fuel usage, you also have similar systems for distance travelled and running time). For fuel usage, the raw data will come from the engine controller sisnce it knows how much fuel is squirted in by the injectors. The idea is that you can sample the counter values at a relatively slow rate. Fuel used (in this case) is the difference between this sample and the previous one. So, as long as you sample at least once per cycle of the counter, you get the right value for the fuel used. To work out the short term and long term fuel efficiencies, you just add all of the individual differences and do some fancy maths.

This makes absolutely perfect sense from realtime perspective, which the vehicle CAN is undoubtedly designed for. It's just a nuisance from analysis point of view as the dbc file syntax is not powerful enough to do the accumulation directly and some additional code is required. For simplicity, I just iterated over all recorded samples and accumulated on 15 bit register overflow - the overflow is anyway frequent enough at every 32.768mL of fuel consumed. No fancy maffs were hurt.

I've encountered also some other signals that are hard or not at all possible to handle with dbc, even by resorting to extended multiplexing. So, while dbc handles the bulk signal extraction nicely enough it's just not covering all the bases.


Fuel tank level will use the signal from the sensor in the fuel tank, not the fuel used signal from the ECM. Many vehicles have only one sensor, but quite a few have more than one. This signal tends to be very noisy (think about fuel sloshing around in the tank as you go over bumps and round corners) so there is a lot of filtering needed to get a stable reading. Add in algorithms to cope with tank filling (and emptying) and resting on slopes and it gets really complicated. Essentially you work out what the fuel level is when the ignition is turned on by comparing the new reading with the reading when you last switched the ignition off. Big changes mean more (or less) fuel in the tank. Small changes are probably due to sitting on a slope.
Finally, there will be a map to convert fuel tank sensor level to true tank level as a percentage. This should compensate for the shape of the tank which will very rarely be a nice rectangular box. Of course, this only works if the tank doesn't change shape between development and actual production of the final vehicle.

Complex indeed. This is basically why I wanted to have a more stable consumption metric, the tank level is pretty coarse and simply wrong in many occasions. I guess one of these days I probably have to make another synthetic consumption estimate signal based on @mmi special formula (using average injection quantities) and see how that compares to what's reported by ECU.

On T6 there's btw this adaptation that might affect how the needle moves - but I haven't looked into it at all and don't know if the reported CAN values would also be affected:
Code:
IDE00714-MAS00888-Additional coding-Tank characteristic curve,1 ,1

@aferris2 any tips on recommended reading materials regarding ECU design, CAN or something along those lines? :p
 
As I wanted to get this metric to see how well it aligns with reported tank level
Well, would be interesting to hear how it would align with VCDS data item "IDE01407 Particle filter: fuel consumption since last regeneration" - which outputs only 10 ml resolution.
 
Fuel (and certain other systems) do cause logistical problems because we (the user) put so much dependance on them. Yes, you can get a much more detailed idea of how much fuel is being used by looking at the counter values, but this doesn't give you any idea of how much fuel you started off with (and therefore how much is left in the tank). That's why you have a fuel level sensor. The problem is that it's only going to give you the right reading if the vehicle is on a level surface and you haven't put a big dent in the bottom of the tank when you last went curb hopping (yes, we had complaints about incorrect readings because of this!). Even with all sorts of algorithms to try to correct the readings, you do rely on the vehicle being on a level surface most of the time.
It's not uncommon to have adaptations (or selections, configurations etc.) that are not used. Often this is because a "standard" software package is used that has options for different manufacturers or drivetrain types. You also see things that are "for future use"
Back to CAN - It's become a standard because is fairly robust (and cheap). You only get up to 8 bytes of data in each CAN frame so it's ideally suited to carry lots of little bits of information. The downside is that you can only have up to 2047 ID's (ignoring extended IDs) so you are limited on the number of individual bits of data that can be transported using direct methods. Add in complications like reserved IDs for different functions like diagnostics and internal network management and you begin to see a significant restriction in the amount of data that can be carried. . This is where multiplexing comes in - you use part of the frame to specify what the rest contains (eg tyre pressures - use one byte to specify the wheel, then several other bytes to give the tyre pressure, temperature etc. Result is that you use one CAN ID to carry all tyre information instead of lots of different IDs for a multi axle lorry).
any tips on recommended reading materials regarding ECU design, CAN or something along those lines?
I doubt you would find anything specific on ECU design apart from generic embedded design techniques to realise something that will work 24/7 without interruption. You won't get away with "Sorry, something's gone wrong. Please disconnect the battery and try again" There are lots of documents around covering how CAN works, from the hardware to techniques of message handling and individual sub-systems like diagnostics and firmware uploads. Search for automotive diagnostics and see where that takes you...
Well, would be interesting to hear how it would align with VCDS data item "IDE01407 Particle filter: fuel consumption since last regeneration" - which outputs only 10 ml resolution.
Only a guess, but this is probably derived from the μL fuel usage counters. Just do a bit of scaling and you can get any resolution you want so that you can see the range of values you are interested in.
 
Yes, you can get a much more detailed idea of how much fuel is being used by looking at the counter values, but this doesn't give you any idea of how much fuel you started off with
Fuel sensor does good enough job of giving me rough idea of how much fuel I have left. I'm after more accurate measurements for detecting long term trend changes... I'm recording all the CAN data, all the time, and deep in the rabbit hole of trying to figure it out. So, the eventual goal is to be able assess changes, both slow and sudden, in consumption and a ton of other signals - in a hope that some developing issues could be detected early. Plus the value from learning and having fun with it ;). Above posting comparing the accumulated consumption against the tank level was basically just an attempt to verify the synthetic signal looks reasonable.

I doubt you would find anything specific on ECU design apart from generic embedded design techniques to realise something that will work 24/7 without interruption. You won't get away with "Sorry, something's gone wrong. Please disconnect the battery and try again" There are lots of documents around covering how CAN works, from the hardware to techniques of message handling and individual sub-systems like diagnostics and firmware uploads. Search for automotive diagnostics and see where that takes you...
Oh I have done a ton of reading on the subject and will continue but there's always the chance that I've missed something obvious. And I absolutely don't claim to be any kind of pro, just curious and willing to try things out in order to learn. Anyway, thanks for this, kind of guessed that intricacies of proprietary designs would not really be spelled out in public.
 
More synthetic signals

Internal CAN emits a slow 1Hz data containing some interesting signals such as soot and wear equivalents and average oil volume data. The data is multiplexed and hence the individual signals are in reality even slower and present only every two or four seconds. Being so slow these are clearly intended for MFD use but are just not utilised in our beloved T6's. Unfortunately, the particular data is multiplexed in such a way that reading all of the data using dbc multiplexing is afaiu not possible - hence I had to add some manual extraction code to even get the data out for looking at.

Soot and wear equivalents are quite strange. They are very small signals in 0 - 0.00131068 range and they do not have any unit, and they are output every 2 seconds. Apparently the soot equivalent is supposed to model rpm and injection quantity while the wear equivalent is more bound to rpm and oil temperature. Looking at the below graphs I wouldn't be able to make such conclusions though. I'm quite uncertain if the small values are supposed to be accumulated - these signals clearly need some further investigation to be of any practical use.

equivalents.png


The two more exciting signals are the average relative oil level, as compared to oil warning threshold, and a warning level adjustment. The interesting thing is that these signals are expressed in millilitres as opposed to millimetre levels that can be queried from advanced measuring values. Specifically, the relative oil volume range goes about 2L below and above the warning level. These signals are output every 4 seconds. Here's the signals plotted against oil temperature, IDE00151_oil_fill_level and IDE00152_oil_warning_threshold:

oil_levels.png

The first observation is that whereas IDE00151 is fairly noisy with lot of invalid (120) values the difference to warning level is quite a bit more stable.

Second, from the engine startup the difference is not output at all. I think the initial gap is either to avoid oil expansion during engine heating to have a significant effect, or the moving average buffers are filled and values are only output when the moving average buffer is filled with enough data points.

Third, whereas both IDE00151 and IDE00152 have a clear correlation with the oil temperature, the difference signal doesn't seem to have (almost) any. This basically means using advanced measuring values the two values should be always used together to determine oil level at least to some extent, while with the pre-calculated difference signal it's enough to look at the single metric.

Fourth, the difference signal seems little bit delayed as compared to IDE00151. This probably means IDE00151 is taken straight off from the level sensor whereas difference signal is an application layer signal from ECU, averaged and filtered.

Fifth, I'm not sure how to interpret the warning level adjustment. At least in this sample it is just a static value - it might be a constant by which the generic parts of ECU software are made to fit different engines that have varying oil fill quantities. This one I need to dig out from a larger sample base to verify it truly is a constant, and maybe even verify manually against raw data to ensure there's no bugs in the conversion.

Finally, using the CAN internal datapoint means I could theoretically free two slots from being queried by CANEdge2 or CarScanner and still have pretty much equivalent information stored, and even in little bit more useful format. The caveat here is that it's not possible to query the difference signal from the likes of the CarScanner so I cannot get a realtime display of the difference signal - and the oil fill level is undoubtedly one of the most important metrics that can be observed.
 
Fifth, I'm not sure how to interpret the warning level adjustment. At least in this sample it is just a static value - it might be a constant by which the generic parts of ECU software are made to fit different engines that have varying oil fill quantities. This one I need to dig out from a larger sample base to verify it truly is a constant, and maybe even verify manually against raw data to ensure there's no bugs in the conversion.

Verified manually from a bunch of recorded raw data that the oil warning threshold offset is indeed constant always.

So, the value kind of does not really matter, unless it should be added to / subtracted from the average oil level difference signal. But I can't think of other ways to test this than to reduce the oil level until oil light comes on and see what the difference signal looks like at that point - I'm up for many tests but not this one :cautious:
 
Hi.. I am using Vgate İcar ( wifi ) and VAG DPF. I can see all process, but I normally need two signals ;

1- Regeneration is needed
2- Regeneration in progress

Do we know any PID codes that we can see above situations at Torque pro app?

Rest is not very critical for me because when reg. is needed, I will know that I need a long drive. When Reg is on progress, I will not stop engine until it finishes.
I see these at VAG DPF, but I use Torque pro app more.
 
1- Regeneration is needed
2- Regeneration in progress

Do we know any PID codes that we can see above situations at Torque pro app?
It depends what engine you have.
How about the post below?
 
Some cold weather observations

Yesterday, embarking on a drive in -20°C, I noticed my CarScanner reporting weird oil level values of 18mm I haven't seen before. Seems at very cold temperatures IDE00151 just bounces in between 18mm and 120mm values - 120mm is known to be a "invalid, no result" value. I wonder if the fill level sensor does 18mm on purpose in some conditions or if something was frozen so that it literally got wrong measurements? Oil temperature started off from -19°C.

oil.jpeg

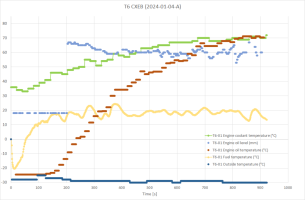
On a same drive, I observed my coolant temperature on CarScanner having hard time reaching and keeping 90°C. This despite of a) having grilles blocked and b) using Webasto to pre-heat the engine. So, I plotted all coolant temperature graphs I currently have from a full drive and added the engine normed load value as a some kind of reference for engine heat production. Three of the coolant temperatures are read from CAN directly while two are queried through CANEdge queries.
  • 'IDE07725 coolant temperature at cylinder head' is the same as 'actual' coolant temperature from CAN
  • The second CAN metric, here called 'gauge' is the big fat lie temperature gauge tells the driver - it just sits at 90°C after the actual temperature reaches 75°C
  • The third CAN metric is from auxiliary heater. We see it starting off from about 40°C, which is the temperature at where cabin blower is turned on and the small coolant circuit is releasing heat to cabin through the heat exchanger. Aux heater coolant temperature only drops below main coolant temperature when engine loads rise significantly
  • On such cold weathers 'IDE07727 coolant temperature at radiator outlet' stays really cold all the way to 480s which is when I went to motorway speeds and the engine load average increases


coolant.jpeg
 
Last edited:
The second CAN metric, here called 'gauge' is the big fat lie temperature gauge tells the driver - it just sits at 90°C after the actual temperature reaches 75°C
This is the "flat response" tweak that was first used I think by Ford. Its was done to cut down on the number of erroneous warranty claims of engines overheating when sat in stationary traffic. As you say, the gauge will show 90°C from around 75 to 105, so the driver will only get alerted if there really is a problem (assuming they even look at the gauge)
 
This is the "flat response" tweak that was first used I think by Ford. Its was done to cut down on the number of erroneous warranty claims of engines overheating when sat in stationary traffic. As you say, the gauge will show 90°C from around 75 to 105, so the driver will only get alerted if there really is a problem (assuming they even look at the gauge)

I guess for the most folks the flat response makes sense and works to reduce unnecessary service and warranty calls. Heck, even I get little bit uneasy looking at the real temperature despite of knowing it's absolutely nothing to worry about :)

But heat is luxury in cold weathers and would rather have little bit more than little bit less...
 
Seems at very cold temperatures IDE00151 just bounces in between 18mm and 120mm values - 120mm is known to be a "invalid, no result" value. I wonder if the fill level sensor does 18mm on purpose in some conditions or if something was frozen so that it literally got wrong measurements?

Did a quick scan today with OBD11 just to look at and clear off dummy faults before service tomorrow and noticed a missing signal fault in oil level/temperature. I think this might be related to 18mm weirdness the other day.

Code:
01 Engine
        System description: R4 2.0l BTD
        Software number: 04L906056AF
        Software version: 6207
        Hardware number: 04L907445A
        Hardware version: H03

        Faults:
                U101900 - Instrument cluster control module
            Missing signal oil level/temperature
                Intermittent


I haven’t really taken a full scan, especially with OBD11, in ages and was positively surprised these days it decodes freeze frames quite nicely for some faults. But not all.

Code:
18 Parking Heater
        System description: STH-T5GP2
        Software number: 7E0963272B
        Software version: 0009
        Hardware number: 7E0963272B
        Hardware version: 003
       
        Faults:
                P056200 - System Voltage
            Low Voltage
                Intermittent
                    Priority - 7
                Malfunction frequency counter - 1
                Unlearning counter - 181
                km-Mileage - 88434 km
                Operating condition of parking heater - After-run - burnout
                --- - 92
                Coolant temperature of parking heater - 27 °C
                Coolant temperature - -8 °C
                Engine running status - Not recognized
                Fuel level - 69 L
                Heater output - 5000 W
                date - 2069-12-03 14:50:00
 
noticed a missing signal fault in oil level/temperature. I think this might be related to 18mm weirdness the other day.
I think those are not related.
At cold temperatures mine reports also oil level steady 18 mm (in addition to 120mm "heartbeat") - has done that always when reasonably cold (start-up below -25°C'ish). The oil is 0W/30 so the most suitable also for winter.
Below a snippet from Friday morning log.
(the 120 mm oil level "heartbeat" is here beyond the scale - not shown here).

1704651617413.png
 
I think those are not related.
At cold temperatures mine reports also oil level steady 18 mm (in addition to 120mm "heartbeat") - has done that always when reasonably cold (start-up below -25°C'ish). The oil is 0W/30 so the most suitable also for winter.
Below a snippet from Friday morning log.
(the 120 mm oil level "heartbeat" is here beyond the scale - not shown here).

View attachment 224647

Thanks, 18mm ”warmup” must be a feature then!

There was no timestamp and as mentioned I hadn’t scanned in a while, so there’s no way to know if the fault was a new or old one. Well, it was intermittent anyway, have to check if it comes back.
 
There was no timestamp
What I have observed is that in the engine the freeze frame (timestamp) disappears after 500 - 2000 km (or possibly after a certain number of ignition cycles) without fault's reoccurrence. So I would say the fault was an old one.
 
Peek into oil consumption

Being armed with a signal to read oil level as compared to warning level I'm now able to look my oil consumption on a little bit longer term. I definitely want to automate this kind of a thing one of these days years, but meanwhile I just have to do the grunt work of manually downloading trip data and extracting the signals I want to inspect. It's slow and kind of tedious.

Anyway, I did just that and looked at my oil consumption over the period Sep/Oct 23. Since the oil consumption is a slow process and not that many data points are really needed I only looked at the trips every Monday. I tend to drive the same route always on Mondays and it's for the most part steady motorway driving, hence the oil level readings should be relatively stable. Of each trip, I took the average oil level and the odometer at the end of the trip.

Code:
Date        Odometer    Oil level
  4.9.2023     82567    1497,6937
 11.9.2023     83074    1458,0616
 18.9.2023     83513    1328,7749
 25.9.2023     84109    1146,3971
 2.10.2023     84538    1104,4837
 9.10.2023     85045    1034,3253
16.10.2023     85642    1038,0349
23.10.2023     86319     901,7026
30.10.2023     86583    1016,8719


Jumping on the dark side of Excel this time around, I charted this small table out. I was able to create a dual axis chart pretty easily but did not find the option to change primary axis type to line graph... go figure, I don't use Excel that much, probably something reaaaallly simple. Anyway, as it can be seen from the plot my mileage was fairly steadily increasing during the period. However the oil level does not seem quite as linear, the levels are even rising in two instances. Therefore, I added the thin linear trend lines to provide an estimation of real consumption.


1705780867325.png

Basing my estimate on trend lines, I see that over the period of two months, my van consumed 0,570L of oil for 4050km travelled. That is, 1,41L for 10000km.

It will be interesting to see how this develops and how well it corresponds to reality. I have a record of dates I've topped oil up but not the exact amounts. My gut feeling is that after the complete oil change the van consumes less for a while and then accelerates towards the end of oil life. But, let's see, this was just the very first look into how oil consumption tracking based on CAN data might look like.
 
Last edited:
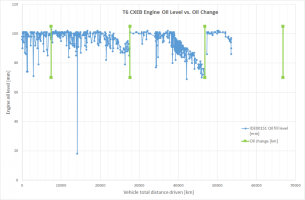
My gut feeling is that after the complete oil change the consumption is smaller for a while and then accelerates towards the end of oil life.
I would agree on that.

1705786770797.png
  • As some of the reading were captured when engine was running (thus the dips), the significant "curve" is the envelope on the "top" of data points..
  • Big dip(s) in the graphs are sensor reading 18 mm before engine start on cold days. Cold = below -20C.
  • The bottom of green "oil change bar" is approx. where "Check oil level" message appears on the dash.
 
I would agree on that.

View attachment 226297
  • As some of the reading were captured when engine was running (thus the dips), the significant "curve" is the envelope on the "top" of data points..
  • Big dip(s) in the graphs are sensor reading 18 mm before engine start on cold days. Cold = below -20C.
  • The bottom of green "oil change bar" is approx. where "Check oil level" message appears on the dash.

I’m on the long-life service schedule but I do change the oils and filter myself roughly half-way into the interval, somewhere around 14000km mark. Still, I have noticed the need to top up more closer to this 14k virtual limit though thus far I haven’t had any analytic look.

Looking at your graph it looks like the oil consumption starts earlier after each change with the van aging. Natural, I suppose, but it does make me wonder to what extent the sooty oil contributes to the engine wear and oil consumption? That is, could the engine life be conserved significantly better if the oils were always changed when the downhill in the oil amount begins?
 
Looking at your graph it looks like the oil consumption starts earlier after each change with the van aging.
The graph is already 2½ years old so needs updating as have accumulated two more oil changes - I do have all the data i the logs but haven't yet got around extracting the data from the log files - because never needed to top up the oil.

Anyways, have been thinking that most likely sticky oil rings could do that. There was even a plan to have carry out VW oil consumption test but as fresh oil would be poured in, the test would result no oil consumption in the 1000 km of the test.

Meanwhile, just supplemented some - to the letter COOL - EGR plots into thread (post #3):
 
Anyways, have been thinking that most likely sticky oil rings could do that.

Right and most likely that’s the case. Still, I find it interesting if the new oil immediately flushes the rings and stops them from leaking to the combustion chamber. :unsure:
 
Back
Top