[T6_measured] Monitoring DPF regeneration, DPF condition, EGR operation

mmi

Senior Expert
VCDS User
Moderator
VIP Member
T6 Legend
Here's another approach for T6 DIY enthusiasts - taking advantage of very popular Carista OBDII-reader device - combined with an Android app.

Ingredients:​

  • T6 EU6 engine: CXEB,CXEC,CXFA,CXGA,CXGB,CXGC,CXHA,CXHB.
  • Carista OBDII device (also other generic OBDII (ELM327) devices will work)
  • Android phone or tab
  • Torque Pro app from Google Play Store (by the way, a £5 software from the UK) Play_Torque.png_½.png
  • A setup file for T6 (attached) - almost plug and play to get the displays and data logging described below

Outcome 1:​

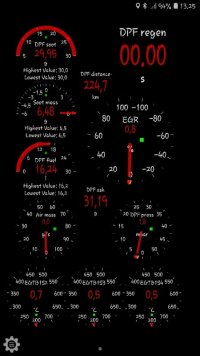
Apologies about a bit disorganised view/screenshot below but this is just the initial/delivery setup.

Most of the available meters are placed on a single page densely because this way the setup can be transferred reliably to other phones/tabs with different screen resolutions (by using attached setup file). Once intial setup is transferred everyone can remove/resize/reconstruct the view to match their own phone/tab preferences.

The measured parameters and their relevance will be explained later on..

Torque-000-Dashboard.jpg

Outcome 2:​

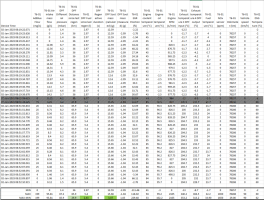
Here's just a snippet of a 53 second log file (only ignition on)
Excel.PNG

The log file contains a few more parameters than the display. Besides displayed also RPM, odometer and vehicle speed are recorded to make a proper log for later examination. To improve sampling rate slowly varying parameters are read only occasionally (e.g DPF ash mass read every 60 seconds, odometer every 30 seconds, Regen duration every 2 seconds).
The "boxed" values at the bottom are calculated based on actual log file (columns A-P)


How-to get started:​

  • On your phone download attached setup file (20221218-B.zip.REMOVE.PLA) - most likely it will go to Downloads folder.
  • NOTE: Naturally Torque (Android file handler) expects file with .zip extension - unfortunately the .zip-extension isn't allowed by Forum thus packaged here with .pla-extension - so please remove the .pla-extension.

  • Plug in Carista device into T6 OBD diagnostics port
  • Pair Carista dongle with your Android phone - if already paired with Carista that's already done

  • Open Torque Pro - it will launch directly to "Realtime Information"/Dashboard view (as Outcome 1).
  • Back up to Torque Main screen (below)

Torque-00000-Main.jpg
  • Settings > Backup/Restore all settings > Restore all settings > look for the previously downloaded setup file "20221218-B.zip"

  • Back up to Torque Main screen (above)
  • Settings > OBD2 Adapter Settings > Choose Bluetooth Device > tick "Carista"
  • Back up till you get to"Realtime Information"/Dashboard view

  • Turn ignition ON
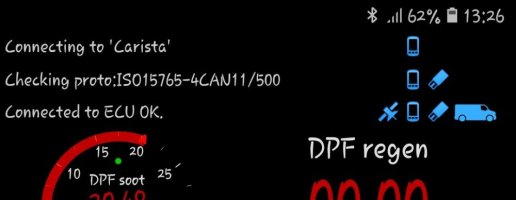
  • Torque establishes communication with Carista, and subsequently with T6 ECU itself - the phases are indicated on top line as follows.

Torque-0500-Connecting.jpg
  • Tweak individual meters by tap and hold
  • > Move display - to move
  • > Display configuration > Change size or Change display type, etc.

NOTE: loading the setup file clears all Torque settings - it's a full restore. So before applying the attached setup, please use "backup all settings"-function to save your own settings.


Any comments/feedback/ideas?


Credit to @outcry666 and @n10n for inspiration and advices how-to unite T6 specific parameters with Torque Pro app


Attachments

  • 20221218-B.zip.REMOVE.PLA
    1.5 MB · Views: 79
Last edited:
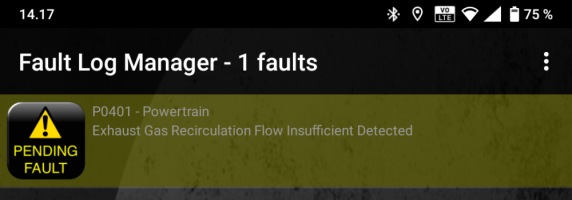
Oh... it does read engine fault codes, too. But only from engine (ECU=Engine Control Unit).

TQ_Engine_Faults_Active_Only_Screenshot_20220919_cropped.png

1681583681417.png

...certainly not correctly.. Below a capture from a Tiguan - which definitely does not have these faults. I'm afraid that such codes don't even exist - the codes were not recognised by OBDeleven. However, the engine had two archived faults (U029D00, P047F00) but it' s a mystery if these were the ones converted into the codes below confused.png
Torque_Tigian_discrepancy_20221228-211255.png
 
Last edited:

EGR operation monitored​

On a quiet road, on a quiet evening got an opportunity to experiment a bit so a few minutes of steady run at different speeds to verify/demonstrate EGR operation - basically increasing recirculation rate as engine load increases - trying to keep NOx emissions still down.

Speeds were: 88, 96 and 105 km/h.
Averaged/plotted EGR positions respectively: 39%, 48%, 57% (the thick grey horizontal bars, average calculated across bar's time).
1672164886840.png


DPF differential pressure measured - to evaluate DPF condition​

The packaged app allows a simple way to check pressure difference across DPF - utilizing engine's own sensor.

To get comparable/meaningful result I'd like to propose following procedure:
  • Turn OFF Stop/Start
  • Warm up the engine and the exhaust (DPF) - a minimum of 20 minutes of sensible driving.
  • Monitor readings at standstill - engine idling at 830 RPM - expected DPF input temperature (below Exh temp 3) approx. 200 °C.
    • Verify that EGR reading is stable -every now and the engine does some kind of calibration running the valve at different positions thus EGR, Air mass and pressure readings vary accordingly.
    • Pressure across the DPF depends strongly of DPF temperature - cold=low pressure loss, hot=high pressure loss
    • Soot content affects also the pressure difference somewhat.
  • Turn OFF the engine (either by Stop/Start button or just turning ignition briefly OFF and back ON - to keep monitoring active)
  • Wait till engine finishes EGR "cleanup" - EGR runs a few times around.
  • Check DPF pressure reading (offset) as the data read is "raw data" from sensor - thus not always exactly zero.

Below an example of a T6 DPF having almost 50000 miles (80000 km).

After a 30 min drive, van parked, engine idling.​


T6F_DPF_press_engine_IDLE_20230102-085205.png


Engine turned OFF, EGR "cleanup" finished.​


T6F_DPF_press_engine_OFF_20230102-085308.png

What else can be seen from the dials​

  • Soot accumulated on the journey was 15.7-12.6 grams = 3.1 grams
  • Fuel used on the journey was 5.4-3.0 litres = 2.4 litres
    • Recorded min/max's is a feature of Torque app - just by selecting dial type (setting button bottom left)
    • Unfortunately the min/max shown is always expressed with one decimal - although the actual display is configurable. However, in the log file the genuine resolution is preserved (see further down)
  • DPF regen counter (regen duration) is used to monitor when active DPF regeneration starts/finishes
  • DSG temperature (a future release) - outside temperature was -6 °C.

In the background​

Besides the above displayed Torque was setup to record a few additional parameters - below a snippet with a couple of first lines as well as last lines of the log.
At the bottom minimum and maximums are created in Excel spreadsheet.

1673176450492.png

For example:
  • The journey was 29.9 km, fuel used was 2.43 litres - thus averaging 8.1 l/100km (equals 34.8 MPG).
  • Soot (calculated) accumulated was 3.07 grams
    • This engine starts DPF regeneration at 30.00 grams and finishes at 9.00 grams
  • NOTE: engine was preheated by Webasto thus coolant was already at 45 °C when started, however oil and fuel were a bit cooler...
  • NOTE: this CXEB engine runs at higher RPM when cold at subfreezing temperatures
 
Last edited:

An extension to monitor AdBlue level and Range counter.

As attachment are two packages:


(1) Revised package for those who haven't yet loaded the initial package from post#1​

How-to install - see post#1​

File: 20231007a-torqueProFullBackup.zip.REMOVE.PLA
Comes with two profiles:​
(a) Profile T6-DPF (the same as in post#1)​
(b) Profile T6-AdBlue​
T6F_Torque_Main_Profile.png
The profiles are independent and have separate dashboards (dials) - select by tapping the Profile-line above.​


Profile T6-AdBlue​

Reads actual AdBlue sensor and related values from Engine Controller. Please compare with the dash readings - they should align.​
T6F_Torque_Dash_AdBlue_20231007.jpgT6F_Dash_AdBlue_7000km_20231007.jpg


Profile T6-DPF​

T6F_Torque_Dash_DPF_20231007.jpg


(2) PIDs only to supplement the initial package in post#1​


File: 20231007a-PIDs.csv

Includes also PIDs to monitor particle (soot) sensor from post#61​

How-to import:​

Torque > Main > Settings > Manage extra PIDs/Sensors > Settings (top right) > Import CSV file​

Listing of the data items in the packages​

T6-01 AdBlue flow​
T6-01 AdBlue level​
T6-01 AdBlue pressure​
T6-01 AdBlue range​
T6-01 AdBlue volume​
T6-01 Air intake mass flow​
T6-01 DPF Ash mass​
T6-01 DPF Differential pressure​
T6-01 DPF Distance since last regen​
T6-01 DPF Fuel since last regen​
T6-01 DPF Regen active duration​
T6-01 DPF Soot mass (calculated)​
T6-01 DPF Soot mass (measured)​
T6-01 DPF Time since regen​
T6-01 EGR Position​
T6-01 Engine coolant temperature​
T6-01 Engine oil temperature​
T6-01 Engine RPM​
T6-01 Lambda​
T6-01 NOx sensor​
T6-01 Odometer​
T6-01 Particle sensor current​
T6-01 Particle sensor operation time​
T6-01 Vehicle speed​
Also the following generic OBD2 data items are included​
Exhaust gas temp Bank 1 Sensor 2 (°C) = after turbo=before catalytic converter​
Exhaust gas temp Bank 1 Sensor 3 (°C) = after catalytic converter=before DPF​
Exhaust gas temp Bank 1 Sensor 4 (°C) = after DPF​


How-to setup additional logging:​

Torque > Main > Settings > Data Logging & Upload > Logging preferences/Select what to log > Settings (top right) > Select what to log > Scroll down to find/tick the desired data.​
Please note that the more data is logged the slower the sampling rate gets. There is also a (vague) limit how many data items can be logged - 10 items seems to be ok, starts to struggle somewhere at 20-30 logged items (only with Carista dongle).​


Attachments

  • 20231007a-PIDs.csv
    2.5 KB · Views: 33
  • 20231007a-torqueProFullBackup.zip.REMOVE.PLA
    1.4 MB · Views: 32
Last edited:
@mmi - this is Brilliant!

Thank you for sharing. :)

After years of using Torque lite, your efforts convinced me to buy the full version (GBP £2.95 today), and I am so pleased that I did. What I did not realise is that the full version can monitor a lot of additional parameters - including NOx - as this functionality was not available to me in Torque lite.

I am especially pleased with this result, as I have recently joined the P20ee code club following a 300 mile journey in sub-zero temperatures. I am reluctant to change any physical components, and your excellent earlier posts on the subject got me thinking about the effects of temperature on NOx - as I am looking for reasons to avoid paying VW to upgrade my (commercial) van software and then having to pay for another remap.

I was about to finally buy VCDS solely in order to troubleshoot and make a decent log/graph of EGR/EGT/IAT etc. vs. NOx, but since Torque appears to have sufficient functionality for my needs I may now have many more beer tokens than expected to enjoy.

Thanks again for your great efforts. :thumbsup:

20221219_133321.jpg
N.B. Engine not started

And a bit off-topic, but this link shows well the effect of temperature on NOx:-


Screenshot_20221219-123038_Firefox.jpg
 
Last edited:
the full version can monitor a lot of additional parameters - including NOx
Have you tried the NOx data (generic OBD data) provided by Torque?

I did some experimenting and I believe there is a mix-up with the sensor naming in Torque app.
Namely, the "NOx post" data is permanently at -100 ppm.
However, the value "NOX Pre SCR" comes to life when the actual T6 sensor has reached it's operating temperature (thus typically engine has been running 10-20 minutes) - and also the fact that T6 does not have a sensor "Pre SCR" but has a sensor "Post SCR".

In T6 the (only) NOx sensor (7 below) is after the SCR processing, thus after the DPF (with NOx trap/converter).
Exhaust_sensors.PNG
Mentions about NOx-sensor warm-up here:

Below a snippet from a recorded (Torque) log - starting at 825 seconds since engine start - lines approx. 1 second apart:
TQ_NOx.PNG
Another peculiarity is that the living data stream "NOx Pre" has constant value "2000.004" up to the point when actual NOx sensor activates.

Yet another oddity are the values after the activation - here the negative values -99.xxxx - actually they spread from approx. -90 down to -100.0000
Looks like a conversion mistake from binary to decimal.

However, just ignoring the "2000.004" and recalculating all the negative values as follows: ( NOx + 100 ) x 32 gives interestingly values (very close) what VCDS reports for T6 NOx sensor.
Plotted below - thus I'm very confident these two values (Torque vs. VCDS) are actually from the same source.

1671746057988.png
 
Thank you once again for sharing such helpful information - since I do not have VCDS I would not have been able to generate such a baseline and so your correlation with Torque results has been an excellent and very welcome piece of reference information.

I did not get a chance to play around with my van until today and can confirm exactly the same findings that you have identified for pre- and post-SCR NOx readings in Torque.


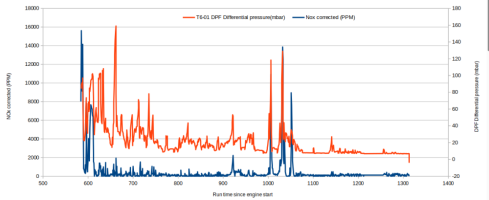
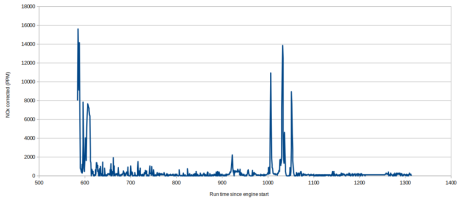
Torque is definitely proving a very useful tool, since using a generic ELM 327 device I have noticed a few significant spikes in my NOx datastream values at various points when logging from a cold start. Although I have not had an opportunity to repeat the test I can see from the logged data a very clear NOx (lagging) correlation against the DPF differential pressure.

Aside from the curious DPF pressure data, it will be interesting to see if the ECU control logic will interpret the duration/values of these spikes in the NOx datastream as sufficient to trigger the P20ee fault when I start using the van again a few weeks from now.

T6_.png

T6__.png

Untitled.png

Untitled2.png
 
Last edited:
Thanks for posting this information, I've downloaded Torque and will go and try it shortly, as a member of the P20EE club and have been told my original 2016 software is fine by VW and it's most likely the EGR cooler causing the fault codes, I'm reluctant to throw money at the van without knowing it will cure it.

Is there a way to decipher the data to see if there is a potential EGR related hardware fault from the stats and what that looks like.

Thanks
 
  • Like
Reactions: mmi
Sussed out how to send the CSV logs to myself now, is there anyone kind enough I could send one too that might be able to understand it ;) I'm doing a 20 mins A road, motorway journey tomorrow so was going to log that.
 
  • Like
Reactions: mmi
Sussed out how to send the CSV logs to myself now, is there anyone kind enough I could send one too that might be able to understand it ;) I'm doing a 20 mins A road, motorway journey tomorrow so was going to log that.
Just attach the logfiles here?
 
Just attach the logfiles here?
Good idea, not sure why I didnt think of that, here are 2 from today although the van was doing a REGEN the whole time!
 

Attachments

  • trackLog-2022-jouluk.-17_12-30-41.csv
    361.7 KB · Views: 12
  • trackLog-2023-Jan-04_09-11-30.csv
    457.4 KB · Views: 5
Oops... it seems that the setup package had a leftover log file (trackLog-2022-jouluk.-17_12-30-41.csv = December 17th) from my testing of some additional parameters - mostly related to AdBlue system facepalm.gif - a future expansion for this Torque T6Forum package

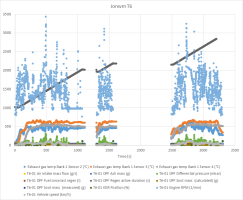
Anyways, all your logs are in the other file (trackLog-2023-Jan-04_09-11-30.csv) which actually consists of three separate journeys (a short breaks in between - see logged time in column "Device time"). Below a fairly cluttered all inclusive plot.

1672863362998.png

Then below a bit less cluttered plot to evaluate how catalytic converter performs. The catalytic converter bumps up and stabilizes exhaust gas temperature before entering the DPF (Diesel Particulate Filter).
Sensor 2 (blue) is the exhaust gas entering catalytic converter (from turbo charger)​
Sensor 3 (orange) is the exhaust gas entering DPF​
Sensor 4 (gray) is exhaust gas temperature after DPF.​
Seems to work extremely well!
1672864143871.png


Also real fuel consumption can be extracted from the log - the counters for accumulated distance and accumulated fuel consumption are reset at end of DPF regeneration.

Device TimeT6-01 DPF Distance since last regen (km)T6-01 DPF Fuel since last regen (l)
START of journey
04-Jan-2023 09:14:05.586
244.4​
19.45​
DPF REGEN END = counters reset
04-Jan-2023 10:07:31.673
266.3​
22.63​
04-Jan-2023 10:07:32.364
0​
0​
END of log/journey(s)
04-Jan-2023 10:09:12.654
0.6​
0.05​
TOTALs for the journey
22.5 km
3.23 litres

More about real fuel consumption vs. indicated on MFD
 
Thanks for that, I literally drove to the shopping centre, dropped something off, drive to the other side of shopping centre to Sainsbury's then home :)

so it appears to be working ok then, maybe I'll go down the software route first then get it back remapped.

again appreciate the effort and explanation, it's fascinating what you can get.
 
  • Like
Reactions: mmi
Sussed out how to send the CSV logs to myself now,
Another convenient way to transfer the logs from a phone - actually all the stored log files at once:
  • Plug in a USB stick (possibly need USB C-adapter)
  • Settings (on Main screen!)
  • Backup/Restore all settings
  • Log Management > Export all journey logs
    • NOTE: might be a good idea every now and then also delete the logs from the phone
  • All log files will be in a single ZIP-package


Post #3 updated with a chapter about a DIY DPF condition evaluation.
Would be interested to see results from other vans and mileages.
 

Observations on Bluetooth and USB dongle performance running Torque app in T6 OBD II -diagnostics port.​

PID = a single measurement value from (Engine) controller, e.g. AdBlue flow [mg/s]
The mentioned T6 engines have more than 1500 PIDs to keep eye on.

To capture rapidly changing values a good sampling rate is essential. However, at the end T6 CANbus gateway anyways sets the upper limit what's available through diagnostics socket.

Performance of selected Bluetooth dongles:​


Carista approx. 12 - 15 PID/second
Carista Evo approx. 35 PID/second


Vgate vLinker MC Bluetooth approx. 30 PID/s

Support Forum​


Chipset (MIC3313) documentation​


Firmware updates​


OBDLink LX,
OBDLink MX+
up to 80 PID/s - however when engine is running the speed throttles down to approx. 45 PID/s . It seems that CANbus gateway prioritises diagnostics requests down.

Support Forum​


Documents​


OBDLink® Family Reference and Programming Manual​

Firmware updates​


The numbers above were recorded by using a quite large dataset of 29 measurement values.

All the above are over Bluetooth connection. I have noticed the the performance varies hugely depending on phone/tablet. The top speed was achieved only on few phones/tables - interestingly an old Android 5 was one of the top performers. Perhaps the performance is down to the actual Bluetooth modem.

As for comparison the almighty VCDS reaches speed of 115 PID/s. However, the connection is USB, and also VCDS takes advantage of some diagnostics protocol enhancements available on T6. Also VCDS at this speed is limited to record maximum of 12 data items (PIDs) - which equals to sampling rate of 9.5 Hz.


EDIT: add

Performance of selected USB dongles (wired connection):​


OBDLink EX engine running approx. 90-100 PID/s - however when engine is not running even 30% higher data rate can be achieved. Possibly it's the ECU itself which restricts data requests while engine running.

Support Forum​


Documents​


OBDLink® Family Reference and Programming Manual​

Firmware updates​


Last edited:
As for comparison the almighty VCDS reaches speed of 115 PID/s. However, the connection is USB, and also VCDS takes advantage of some diagnostics protocol enhancements available on T6
I think that is fairly close to bus (or at least some control unit) native maximum as I’ve observed from the other side of the gateway.

Have you noticed if VCDS gets throttled to 45 PID/s with engine running? Just thinking the drop might simply come from the Bluetooth radio environment getting much more hostile with engine running and infotainment interfering in BT frequencies as well.
 
Have you noticed if VCDS gets throttled to 45 PID/s with engine running?
Thanks for asking. Interestingly VCDS stays at the same steady rate 115 PID/s - both engine not running and engine running. Hence my assumption of some special way to handle the protocol in VCDS (Grouping). The grouping really makes the difference and to actually reach the mentioned top speed also the "Bypass Windows Timers" needs to be ticked. Without the speed is somehat slower.
1688367277898.png

Just thinking the drop might simply come from the Bluetooth radio environment getting much more hostile with engine running and infotainment interfering in BT frequencies as well.
Yes, I'm curious about that, too. Interestingly the phenomena can be reproduced consistently. Starting the engine throttles down the speed. And letting the engine to shut-off by start/stop, the speed bumps up again - thus I have thought the Infotainment alone shouldn't be a factor here. Anyways, having Infotainment just paired with the "subject under test" affects the speed.
 
Interestingly VCDS stays at the same steady rate 115 PID/s - both engine not running and engine running. Hence my assumption of some special way to handle the protocol in VCDS (Grouping). The grouping really makes the difference and to actually reach the mentioned top speed also the "Bypass Windows Timers" needs to be ticked.

Now this is interesting. I wonder if the grouping occurs really in the UDS request level in CAN or if it just optimises the handling of requests over the serial USB interface? In the latter case it could be the VCDS is telling the dongle to fetch a bunch of values and hence there would be smaller number of back and forth transmissions over USB.

I see this calls for testing :laugh:. Could you prepare a test case with and without grouping and instruct me on how to execute it? I'll then record / filter what's going on beyond the gateway and we can see if the actual UDS handling changes somehow.

thus I have thought the Infotainment alone shouldn't be a factor here
Yes, after writing above I also realised infotainment is also on with ignition on so it can't fully explain the drop

Edit: "and we can see if the actual UDS handling changes somehow" - maybe, UDS is already pretty high level protocol and it might be necessary to look at link layer, which we can't really see, to figure out what is going on. Still, just looking at messages / timestamps could tell something.
 
Last edited:
Now this is interesting. I wonder if the grouping occurs really in the UDS request level in CAN or if it just optimises the handling of requests over the serial USB interface? In the latter case it could be the VCDS is telling the dongle to fetch a bunch of values and hence there would be smaller number of back and forth transmissions over USB.

I see this calls for testing :laugh:. Could you prepare a test case with and without grouping and instruct me on how to execute it? I'll then record / filter what's going on beyond the gateway and we can see if the actual UDS handling changes somehow.


Yes, after writing above I also realised infotainment is also on with ignition on so it can't fully explain the drop

Edit: "and we can see if the actual UDS handling changes somehow" - maybe, UDS is already pretty high level protocol and it might be necessary to look at link layer, which we can't really see, to figure out what is going on. Still, just looking at messages / timestamps could tell something.

Ok, some interesting insight from Ross-Tech regarding UDS grouping and also the magic Turbo button. Apparently grouping indeed goes all the way to ECU - will definitely, at some point, be worthy to check how this looks like from raw CAN perspective.


a test case with and without grouping
Attached a test setup file for 01-Engine - in PDF disguise - needs to be stripped down to .u01 -extension for VCDS. It's the same setup file I have used to verify recording speed.

Load the file TEST-A.u01

IDE00021 Engine RPM [/min]
IDE00075 Vehicle speed [km/h]
IDE00347 Air mass: actual value: [g/s]
IDE00407 Rail pressure regulation: status
IDE00472 Mean injection quantity [mg/stroke]
IDE07379 Cylinder charge: spec. value [mg/stroke]
IDE07381 Cylinder charge: act. value calculated [mg/stroke]
IDE07801 Mass airflow sensor 1 bank 1 airflow: raw value [mg/stroke]
IDE07818 Fuel high pressure sensor: actual value [bar]
IDE07821 Fuel metering valve: activation [%]
IDE07822 Fuel pressure regulator valve: activation [%]
IDE09340 Primary injection: quantity setpoint [mg/stroke]

1688384766014.png

1688384802479.png


Then it should be a straightforward thing to run with, or without. Just tick them both, or none.
1688384640046.png

Log & Start logging....

Looking forward to your report Jumping.gif


Anyways - trying to maximize the speed by bypassing Windows Timers can lead to some unexpected behaviour. However, it seems that firmware updates have cured most of the wrinkles. Still occasionally (no more than 1/hour) have seen an extra pause of 150 ms laugh.gif


Attachments

  • TEST-A.u01.REMOVE.PDF
    120 bytes · Views: 5
Back
Top