VW T6 Custom PID codes for DPF

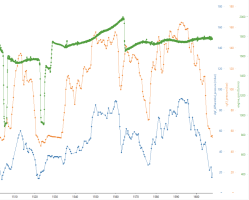
It's been a bit slow but finally got around testing plotting directly with Python and matplotlib library without R. Thanks for the tip regarding more than two axes @ebiii !

So, here's the above plot having everything in single plot instead of piling them up vertically.
  • Saves space
  • Can get confusing with many signals
  • Can't really use horizontal grid lines (or at least should use on main axis only)
  • Discrete signals by scale + offset, no need for axis
  • Although perhaps more confusing than piled style, there's still value as usually the danger of misinterpretation is low

1691337837856.png

And for anyone interested, here's the corresponding Python code:
Python:
import numpy as np
import pandas
import matplotlib.pyplot as plt
from mpl_toolkits.axes_grid1 import host_subplot
import mpl_toolkits.axisartist as AA

coasting = pandas.read_csv("hot.ChannelGroup_0_CAN1_-_message_dsg_10hz_0x359.csv")
speed = pandas.read_csv("hot.ChannelGroup_1_CAN1_-_message_kombi_1_40hz_0x320.csv")
ambient_temperature = pandas.read_csv("hot.ChannelGroup_2_CAN1_-_message_mfd_50hz_0x527.csv")
oil_temperature = pandas.read_csv("hot.ChannelGroup_3_CAN2_-_message_engine_7_50hz_0x588.csv")

df = pandas.merge(
    pandas.merge(coasting, speed, on = 'timestamps'),
    pandas.merge(ambient_temperature, oil_temperature, on = 'timestamps'),
    on = 'timestamps'
)
df.rename(inplace = True, columns={
    "CAN1.dsg_10hz.coasting": "coasting",
    "CAN1.kombi_1_40hz.kombi_speed_actual": "speed",
    "CAN1.mfd_50hz.ambient_temperature": "ambient_temperature",
    "CAN2.engine_7_50hz.oil_temperature": "oil_temperature"
})

# Scale + offset coasting to main axis
df['coasting'] = df['coasting'] * 5 + 5

print(df)

fig = plt.figure()
plt.subplots_adjust(right = 0.75)

color = 'tab:blue'
r1c1ax1 = host_subplot(111, axes_class = AA.Axes)
r1c1ax1.set_xlabel('Time (s)')
r1c1ax1.set_ylabel('Speed [km/h]', color=color)
r1c1ax1.plot(df['timestamps'], df['speed'], color=color, label = 'Speed')
r1c1ax1.plot(df['timestamps'], df['coasting'], color='tab:gray', label = 'Coasting')
r1c1ax1.tick_params(axis='y', labelcolor=color)
r1c1ax1.set(ylim = (0, 130))
r1c1ax1.set_xticks(np.arange(0, 2200, 120))
r1c1ax1.grid(axis = 'x')

color = 'tab:green'
r1c1ax2 = r1c1ax1.twinx()
r1c1ax2.axis["right"].toggle(all=True)
r1c1ax2.set_ylabel('Ambient temperature [°C]', color=color)
r1c1ax2.plot(df['timestamps'], df['ambient_temperature'], color=color, label = 'Ambient temperature')
r1c1ax2.tick_params(axis='y', labelcolor=color)
r1c1ax2.set(ylim = (20, 50))

color = 'tab:red'
r1c1ax3 = r1c1ax1.twinx()
r1c1ax3.axis["right"].toggle(all=True)
r1c1ax3.axis['right'] = r1c1ax3.new_fixed_axis(loc = 'right', offset = (60, 0))
r1c1ax3.set_ylabel('Oil temperature [°C]', color=color)
r1c1ax3.plot(df['timestamps'], df['oil_temperature'], color=color, label = 'Oil temperature')
r1c1ax3.tick_params(axis='y', labelcolor=color)
r1c1ax3.set(ylim = (0, 120))

r1c1ax1.legend()
fig.tight_layout()
plt.show()
 
I've been playing with UDS group requests for quite some time now, some details in thread [T6_measured] Monitoring DPF regeneration, DPF condition, EGR operation

However, no software directly supports parsing multiframe UDS responses, and I had to start looking into devising my own. Specifically, given a response
Code:
18.7005999999999979;7E8;10 1D 62 58 52 01 F7 44       - First Frame, 29 (0x1D) bytes to follow
                                                      - Service 0x62 = response to service 0x22
                                                      - Followed by a list of 4 byte responses in the
                                                        same order they were asked for
18.7030499999999975;7E0;30 00 01 55 55 55 55 55       - Flow control response from VCDS                                                       
18.7032999999999987;7E8;21 5F 06 69 44 5E 11 34       - Consecutive Frame 1 (0x21)
18.7056000000000004;7E8;22 44 60 0B 4A 44 C9 0E       - Consecutive Frame 2 (0x22)
18.7076499999999974;7E8;23 93 43 67 12 73 43 2F       - Consecutive Frame 3 (0x23)
18.7093999999999987;7E8;24 14 0B AA AA AA AA AA       - Consecutive Frame 4 (0x24)
                                                      - Padding bytes 0xAA to even 8 byte frame

my idea was to convert this back to individual frames as if they would have been queried individually. If that works, we can then use the DBC file and eg asammdf software like before. So, the converted responses would then look something like

Code:
18.7005999999999979;7E8;01 05 62 58 52 01 F7 AA     - PID 58 52 value 01 F7
18.7005999999999979;7E8;01 05 62 44 5F 06 09 AA     - PID 44 5F value 06 09
18.7005999999999979;7E8;01 05 62 44 5E 11 34 AA     - PID 44 5E value 11 34
18.7005999999999979;7E8;01 05 62 44 60 0B 4A AA     - PID 44 60 value 0B 4A
18.7005999999999979;7E8;01 05 62 44 C9 0E 93 AA     - PID 44 C9 value 0E 93
18.7005999999999979;7E8;01 05 62 43 67 12 73 AA     - PID 43 67 value 12 73
18.7005999999999979;7E8;01 05 62 43 2F 14 0B AA     - PID 43 2F value 14 0B

So, what's the point? By using group requests I can make CarScanner and queries from CANEdge2 not stepping into each others toes - basically putting any nonsignificant load to bus with CANEdge2 using normal queries will make CarScanner dashboards stop working completely. The group requests would do that too but luckily OBD Link MX+, the OBD dongle I'm using with the CarScanner currently, has a filtering feature that can be used to remove multiframe responses from being transmitted over the slow bluetooth interface.

The absolute good news is that I've been able to make above conversion work with my Python script and proven I can use normal DBC file to get the individual signals out from UDS multiframe responses just like if I had originally queried them using individual PIDs. For example, here's a small snippet of engine rpm @100Hz vs DPF differential pressure @2.5Hz vs cyl3 pressure @2.5Hz. This was made by running 2.5hz multiframe queries, running the Python script (with DBC) to create a "filtered" MDF file and then opened that up in asammdf. In total, being currently conservative, I can get all the CAN data at their native frequencies, such as RPM here, and 40 sensors at 2.5Hz while still keeping CarScanner operational to show a real time dashboard :think smile bounce:

1691780321705.png

However, it's not all walk in a park unfortunately. Most of issues relating to MDF format itself I've managed to work around now in Python (I think), but turns out coming up with a decent set of 40 PIDs to query using UDS group requests is more challenging than expected. It seems some PIDs just don't like to work in group requests. Or maybe some of them don't like each other, or are just slow to fetch and therefore break down the frequency plan. I've gone through a bunch of iterations but each time I try to fix the previous problems I introduce some new ones and some of my groups stop working. For example, from the very same dataset as above I tried to show DPF simulated surface temperature and got only a small number of samples here and there. This is an indication that the group containing this query works, but only sometimes:

1691781203192.png

So, lot of trial and error needed still to get a good quality coherent set of sensors that agree to play along nicely.

Also, not all signals convert as expected. For example, fuel metering valve activation is supposed to be % so I just used the same formula in DBC than other similar signals. But, obviously something is wrong, pretty high percentages there... but this just means a conversion error, need to double check measurements with VCDS and come up with a proper formula.

1691781691831.png

Thus overall, I've had some nice progress and now I know for sure I can make it all work together simultaneously:
  • Recording / using all native CAN data
  • Querying custom PIDs at least at 100Hz (40 x 2.5Hz) and maybe more / faster
  • Having a CarScanner realtime dashboard working and updating with reasonable frequency
Just still a ton of quality time needed for testing different configurations and validations with VCDS to ensure what comes out is legitimate and trustworthy.

Oh and I'm currently hacking this together in late night mode while travelling with the van, tweaks at night for the next day :p. I was kind of expecting to get the PID set stabilised for the trip but there's just too few hours in a day...
 
Using CarScanner Action PIDs

CarScanner Action PIDs are basically sensors that don't have a value. When you tap the action, it sends something to the CAN bus and never expects any response. Typical use for Action PIDs would be to command some vehicle functions such as lock the doors or initiate a forced regeneration.

However, since I'm recording what happens in the CAN busses the Action PIDs can be used as a convenient markers. If car does something funny or I see something interesting, I might want to mark the position so that it's easier to find the corresponding moment in the data and look at what the car did at that point.

To create a Action PID, you just create a normal custom sensor but mark it as action PID. I've used 7E4 as a header here since I don't have any actual CAN data in that address and I know CAN gateway is happy to copy 7E0 - 7E7 messages to the internal CAN buses. The command doesn't matter much in this case, just some values that is unlikely to match anything the car would consider interesting:

1691995556846.png


Then, in my CarScanner dashboard, I've mapped the Action PID to a dashboard slot. At first, I could not find the Action PIDs at mappable sensor list at all. It took longer than I like to admit to figure out that the 'View' section, where it reads 'Action PID' now, initially reads 'Text' and must be changed to 'Action PID' before the action can be chosen from the sensor selection:

1691995780107.png


Having the Action PID placed in dashboard, I see the 'DROP FLAG' text above my oil level gauge:

1691995883936.png


Once I tap the 'DROP FLAG' text, CarScanner thinks for a second and then I have to close the popup it shows:

1691995960298.png


I then added this section to my DBC file. Here, I've marked two possible actions FF01 and FF02 - I'm considering using separate actions for car related points of interest and a second one for the actual position or surroundings - so this just shows how I could use multiple Action PIDs to annotate different kinds of events.

Code:
BO_ 2020 action_pids: 8 0x7E4FlagsSentFromCarScanner
    SG_ MultiplexIndexSignal M : 15|16@0+ (1,0) [0|0] "" Vector__XXX
    SG_ flag_position m65281 : 23|8@0+ (1,0) [0|1] "" 0xFF01
    SG_ flag_vehicle m65282 : 23|8@0+ (1,0) [0|2] "" 0xFF02


Having the definition in place in DBC, I will just get the taps like any other signal for analysis. Here, I tapped the Action PID three times with about 10 second interval and plotted the taps in asammdf against car speed and odometer:

1691996467068.jpeg
 
Plot monster!

Still little bit rough on the edges but here's a monster plot of couple of CAN default signals, all of the UDS group requests from CANEdge and finally few CarScanner queries. The drive lasted about 1/2h and included a regen plus a section on a motorway.

No way to put the image on a webpage so this just a teaser and full plot as PDF. RStudio munches some 20 minutes to create this plot :)


1692309296196.png

Some of plot names are hard to read presently so here's the list of included metrics
Code:
colnames(csv_00)[2] = "rpm"
colnames(csv_01)[2] = "accelerator_pedal"
colnames(csv_02)[2] = "speed"
colnames(csv_04)[2] = "lambda"
colnames(csv_05)[2] = "main_timing_demand"
colnames(csv_06)[2] = "vgt_valve_position"
colnames(csv_07)[2] = "main_injection_advance"
colnames(csv_08)[2] = "main_injection_duration"
colnames(csv_09)[2] = "regen_current_duration"
colnames(csv_10)[2] = "regen_time_since_last"
colnames(csv_11)[2] = "regen_soot_mass_calculated"
colnames(csv_12)[2] = "regen_km_since_last"
colnames(csv_13)[2] = "mean_injection_quantity"
colnames(csv_14)[2] = "adblue_heating_1_current"
colnames(csv_15)[2] = "adblue_heating_2_current"
colnames(csv_16)[2] = "adblue_tank_temperature"
colnames(csv_17)[2] = "standardized_air_flow_ratio"
colnames(csv_18)[2] = "air_mass_at_meter_1"
colnames(csv_19)[2] = "fuel_pressure_regulator_current"
colnames(csv_20)[2] = "adblue_specified_injection_quantity"
colnames(csv_21)[2] = "intake_manifold_pressure"
colnames(csv_22)[2] = "dpf_differential_pressure"
colnames(csv_23)[2] = "air_temperature_at_charge_air_cooler_output"
colnames(csv_24)[2] = "fuel_metering_valve_activation"
colnames(csv_25)[2] = "fuel_pressure_regulator_valve_activation"
colnames(csv_26)[2] = "coolant_temperature_at_cylinder_head"
colnames(csv_27)[2] = "cyl3_pressure"
colnames(csv_28)[2] = "egr_valve_activation"
colnames(csv_29)[2] = "egr_temperature"
colnames(csv_30)[2] = "air_temperature_at_turbo1_output"
colnames(csv_31)[2] = "bypass_valve_for_turbo1_turbine_inlet_activation"
colnames(csv_32)[2] = "adblue_injector_activation"
colnames(csv_33)[2] = "coolant_temperature_at_radiator_outlet"
colnames(csv_34)[2] = "air_temperature_at_turbo1_turbine_output"
colnames(csv_35)[2] = "air_temperature_at_turbo1_turbine_input"
colnames(csv_36)[2] = "fuel_temperature"
colnames(csv_37)[2] = "particle_sensor_measuring_current_calculated"
colnames(csv_37)[3] = "particle_sensor_time_in_op_mode_measurement"
colnames(csv_38)[2] = "nox_sensor_after_scr_nox_concentration"
colnames(csv_39)[2] = "primary_injection_quantity_setpoint"
colnames(csv_40)[2] = "normed_load_value"
colnames(csv_41)[2] = "fuel_pressure"
colnames(csv_42)[2] = "ambient_air_pressure"
colnames(csv_43)[2] = "oil_fill_level"
colnames(csv_44)[2] = "awd_temperature"
colnames(csv_45)[2] = "dsg_temperature"

EDIT: 32 -> adblue_injector_activation
EDIT: replaced PDF with improved version
 

Attachments

  • RegenDriving_v2.pdf
    1.3 MB · Views: 16
Last edited:
Plot monster!

Still little bit rough on the edges but here's a monster plot of couple of CAN default signals, all of the UDS group requests from CANEdge and finally few CarScanner queries. The drive lasted about 1/2h and included a regen plus a section on a motorway.

This was the first result of getting the data recorded with full internal CAN, 40 pids @2.5hz using UDS group requests and CarScanner running simultaneously, and getting it all processed through my Python script and out for analysis. Turns out I had some issues with the script still that made earlier attempts fail unpredictably - most notably, the raw data seems to have some amount of either duplicate or lost frames. This broke multiframe processing so that some parts of reassembled multiframes got corrupted with data from wrong queries and this led to weird results.

After checking a bunch of result CSVs I still seem to experience about 7-9% data loss in UDS group requests. It sounds much but actually I'm not too worried - it's not pretty but I think the monster plot shows there's quite enough accuracy to see the overall functions just fine. It's not like 2.5Hz sample rate would allow for very zoomed in deep dives anyway. The current theory is that running CarScanner still steps on toes of CANEdge programmed querying and leads to the data loss, they are operating in the same 7E0/7E8 pair after all. This should be fairly easy to verify one of these days.

Although this was mostly still data quality test rather than a look into any specific vehicle topic, some observations / learnings from the plots:
  • At regen, higher temperatures achieved mostly by increasing injection quantity, not duration
  • However injection advance is also reduced during regen. Does later injection let more unburned fuel to exhaust?
  • Air flow ratio / lambda increases radically after regen as not so much fuel is burned - from riches to leanses
  • Rail pressure is also kept slightly higher during regen
  • Turbo runs extremely hot during regen. I don’t quite see the connection there… maybe just because voltage is kept high so the alternator is putting more strain to the engine, as pointed out by the normed load. Or maybe just more air is pushed through as well in order to enable combustion in the DPF, air masses seem to be higher as well? Also VGT valve shows turbo is used much less after regen completes.
  • EGR is nice and cool (closed) during regen, no doubt as an effort to let more combustive exhaust to DPF
Looking at the plots it's obvious my PID selection is by no means ideal presently. And to be honest, I'm not sure what the definition of ideal would be here... I think some sort of "little bit of everything, likely to show abnormalities in one way or other" -style set would be good. But now that I have a working baseline it's much easier to start tuning and testing changing individual PIDs and ensuring it all still works after changes.
 
A look into oil fill level

As our T6's are known to eat some oil the oil fill level is for sure one of the most important metrics to follow. Getting now the oil fill level to the always recorded data I took a closer look to understand little bit better how it behaves during the drive.

Firstly, the oil fill level is quite noisy. Naturally, oil moves all the time and wallows around especially when cornering. To get a little bit smoother signal, I used R zoo library to calculate a centred moving average of the oil fill level and plotted it in red on top of the noisy oil fill level. Also, I added the oil temperature as another dimension and got a plot like this:

1692522879722.png


It can be seen the fill level definitely has a correlation with the temperature, and the moving average helps out to see the fill level trend curve little bit easier.

I used k = 40 in the moving average calculation, ie 40 samples in total are used to calculate the average. Centred MA means the average is placed at the centre point of the samples, hence the gaps in the start and end of the plot.

The actual R snippet to do this was very easy. We just use rollmean() function to calculate a moving average over 40 samples and make a new column ma to the data using mutate() function. Then we plot it in the same graph together with the original signal:
Code:
packages.install("zoo")
library(zoo)

plot_43 <- csv_43 %>%
  select(timestamps, oil_fill_level) %>%
  na.omit() %>%
  mutate(ma = rollmean(oil_fill_level, k = 40, fill = NA)) %>%
  ggplot() +
  geom_line(aes(x = timestamps, y = oil_fill_level), linewidth = 0.4, alpha = 0.75, color = "deepskyblue4") +
  geom_line(aes(x = timestamps, y = ma), linewidth = 0.8, alpha = 0.75, color = "red") +
  scale_x_continuous(breaks = seq(0, TIME_RANGE[2], by = TICK_INTERVAL), expand = c(0.01, 0.01), limits = TIME_RANGE) +
  scale_y_continuous(breaks = seq(50, 120, by = 10), limits = c(50, 120)) +
  ylab("oil_fill_level [mm]") +
  theme_minimal() +
  theme(
    axis.title.x = element_blank(), axis.text.x = element_blank(),
    axis.title.y = element_text(margin = margin(t = 0, r = 0, b = 0, l = 0)),
    plot.margin = margin(t = 0, r = 5.5, b = 0, l = 5.5))

Looking at the plot, we can see in the timespan of 120-420s oil level increases from 85mm to 97mm, while the temperature increases from 38 to 89°C. The expected new motor oil thermal expansion is 4.8% / 120°F or 0.098% / °C. From this, we can calculate the oil thermal expansion during the time span should be about 5%. Since the level metric increases about 14.1% as opposed to 5%, thermal expansion alone does not explain the level increase. And yes, I actually changed my oils just couple of days ago so the plots are indeed with a new oil.

From 720s onwards, the fill level seems to decrease. This is due to oil movement resulting from driving in more curvy roads. To see the correlation we can look at the lateral (side to side) acceleration - for proper analysis acceleration in all axis should be considered but even this one serves to show the change definitely ties in with the car motion.

1692526586189.png

Finally, engine blockmap of mine shows the warning level for oil is at 66mm:

Code:
IDE00152,Oil warning threshold,66, mm

As we know the oil capacity is 7.4L and the fill level at capacity is supposed to be 100mm, we can estimate the oil warning comes up when about 2.5L is lost (100mm - 66m) * 74mL / mm. However, I have no idea how the ECU averages the fill metric, if it does some temperature compensations or even if 0mm actually means completely empty oil sump. So, this is just a very coarse guesstimate - still, it helps me to ensure I notice the oil level decrease well before entering the warning light region without looking at the dipstick.

Edit: fixed few typos, added a doubt about if 0mm means no oil at all
 
Last edited:
Testing 200 pid/s group UDS queries

200 pids/s is the maximum that can currently be reached by CANEdge configuration from a single control unit, due to timing limits allowed in configuration. The queries can be split at least as 8@25Hz, 16@12,5Hz or 40@5Hz variants. In this one I tested 8 pids @25Hz, and plotted them against rpm from default CAN messages. The PIDs in this test are:

ENG126008_injection_speed_cyl1
ENG126009_injection_speed_cyl2
ENG126010_injection_speed_cyl3
ENG128778_injection_speed_cyl4
IDE12085_injection_time_deviation_cyl1
IDE12086_injection_time_deviation_cyl2
IDE12087_injection_time_deviation_cyl3
IDE12088_injection_time_deviation_cyl4

The test was just flat throttle, vehicle not moving, hence 2400 rpm cap. Interesting how injection timing deviation goes right to zero shortly after reaching high rpm's but soon deviates again a bit when returning to idle. Injection speeds do not really reveal anything interesting.

This was my first step in building kind of diagnostic special configurations which I can swap in if / when I need to look at a specific topic of interest.

1693086547238.png

Edit: btw, injection speed is somewhat confusing. In the CAN, we get 4x speed so I plotted them like VCDS does, divided by four. But at the same time, we know that there’s two revolutions of crankshaft for each power stroke, so the main injections should only occur at half of crank rpm. And finally, in addition to main injection, there are multiple pre- and post-injections. Not sure what the correct interpretation would be but at least showing it like VCDS does makes the metric comparable to other measurements.
 
Last edited:
The queries can be split at least as 8@25Hz, 16@12,5Hz or 40@5Hz variants.

Here's another example with 16@12,5Hz, with the following pids:
  • IDE00385_injection_pre2_start
  • IDE00386_injection_pre2_duration
  • IDE01380_injection_pre3_start
  • IDE01381_injection_pre3_duration
  • IDE00351_main_injection_advance
  • IDE00352_main_injection_duration
  • IDE09340_primary_injection_quantity_setpoint
  • IDE00387_injection_post1_start
  • IDE00388_injection_post1_duration
  • IDE10829_injection_post1_quantity
  • IDE00389_injection_post2_start
  • IDE00390_injection_post2_duration
  • IDE10815_injection_post2_quantity
  • IDE01382_injection_post3_start
  • IDE01383_injection_post3_duration
  • IDE10830_injection_post3_quantity
There's something fishy with how the injection start points are picked. VCDS shows pre -injection angles as positive, which doesn't really make sense. Here, I applied same formula for pre/post injection starts than what is used for main injection - that is more or less known to be correct. At least that puts pre-injections to negative (advance) which kind of makes more sense.

Since only 16 pids can be fit into the query, I left pre1 injection point out. That might have been the wrong choice as it seems in CXEB pre-injections are used more than post-injections. Oh well...


1693129247118.png
 
VCDS shows pre -injection angles as positive, which doesn't really make sense.
I think it's just the naming (pre/post) is not correct. It seems that Cxxx-series EU6 engines do not have a dedicated pre-injection. It's always the main injection first, and then 1-2 bursts with fixed timing (at +2...+14 degrees) to keep up cylinder pressure with minimal noise.

Cxxx-series EU5-engines did an actual pre-injection before main injection (under certain (fairly rare) conditions) but the duration was very short (compared with the other injection bursts). Another difference is that all the injection timings are dynamic full time.

Oh, then again the DPF regen is another story.


The following ones are "dead" on mine (CXEB).
  • IDE00383 Pre-injection 1: activation start
  • IDE00384 Pre-injection 1: activation duration

  • IDE00387 Post-injection 1: activation start

  • IDE00389 Post-injection 2: activation start
  • IDE00390 Post-injection 2: activation duration

but interestingly
  • IDE10815 Post injection 2: quantity spec. value
is alive. Perhaps another naming issue?

Also we seem to totally miss quantities for the "pre"-injection channels? So can't calculate fuel consumption by summing up individual injection bursts?
 
I think it's just the naming (pre/post) is not correct. It seems that Cxxx-series EU6 engines do not have a dedicated pre-injection. It's always the main injection first, and then 1-2 bursts with fixed timing (at +2...+14 degrees) to keep up cylinder pressure with minimal noise.
Sounds plausible. Probably there’s just a fixed number of secondary injection slots available in the base software, which can be configured as pre/post as necessary by the map. Then it’s just a historical mishap they are named as they are in VCDS.

The following ones are "dead" on mine (CXEB).
  • IDE00383 Pre-injection 1: activation start
  • IDE00384 Pre-injection 1: activation duration

  • IDE00387 Post-injection 1: activation start

  • IDE00389 Post-injection 2: activation start
  • IDE00390 Post-injection 2: activation duration
:thumbsup:

but interestingly
  • IDE10815 Post injection 2: quantity spec. value
is alive. Perhaps another naming issue?

Maybe. Would be really interesting to read the docs from where VCDS devs have pulled the namings… I’ve searched high and low for ”funktionsrahmen” for DCM 6.2V diesel, it might answer some of these weirdities, so far not found.

Also we seem to totally miss quantities for the "pre"-injection channels? So can't calculate fuel consumption by summing up individual injection?
Seems so. Then again, VCDS might not have all the PIDs… project for another year but would be interesting to query PIDs that are *not* in VCDS and see if ECU responds anything :geek:
 
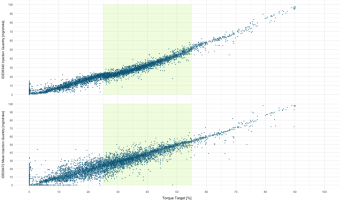
Long and pretty steady drive but includes couple of accelerations from intersections etc. Some more aggressive drive parameter variations might change the graph a bit. But this goes to show injection quantity, and hence consumption, is pretty linear with torque requested from engine. The requested torque includes everything: drive through gearbox, aircon, alternator.

1693249365353.png

Edit: I suppose I should aim to operate my van at 25 - 55% torque target range as that should result in slightly increased mgp :geek:
 
Last edited:
Long and pretty steady drive but includes couple of accelerations from intersections etc. Some more aggressive drive parameter variations might change the graph a bit. But this goes to show injection quantity, and hence consumption, is pretty linear with torque requested from engine. The requested torque includes everything: drive through gearbox, aircon, alternator.

View attachment 211386

Edit: I suppose I should aim to operate my van at 25 - 55% torque target range as that should result in slightly increased mgp :geek:

Here's a little bit more balanced leg of the same long trip with larger percentage b roads and not as much dull cruising. Also marked the area where injection quantity falls under linear line (ie more economical driving) with green background. And finally, added vehicle pitch as another dimension. While it's natural the lowest torque targets (and consequently consumption) occur in downhill, the relation is not straightforward at all. I am surprised by how little the uphills affect the torque target, there's only a very slight upward trend in the green area due to higher pitch requiring higher torque. Overall, fairly flat terrain though throughout the drive. Where are all the mountains when they're needed!?!

1693298705576.png
 
Last edited:
Fascinating - now I got curious how would
IDE00472 Mean injection quantity​
compare with IDE09340 in the above plots.

Based on a few logs I have thought IDE00472 Mean injection quantity could be sum of all injections (possibly excluding regen specifics), and IDE09340 would be purely the main injection.
In the logs the IDE00472 has always been somewhat bigger than IDE09340.
IDE00472 vs. IDE09340 [mg/stroke]
16.07 vs. 14.00[ (EDITed)​
18.20 vs. 15.83​
20.07 vs. 18.09​
18.83 vs. 16.28​
21.37 vs. 18.64​
18.82 vs. 16.31​
21.05 vs. 12.92 (regen)​
15.61 vs. 13.52​
20.79 vs. 18.16​
18.59 vs. 15.96​
20.28 vs. 17.64​
(20221114...20221122)
 
Fascinating - now I got curious how would
IDE00472 Mean injection quantity​
compare with IDE09340 in the above plots.

Based on a few logs I have thought IDE00472 Mean injection quantity could be sum of all injections (possibly excluding regen specifics), and IDE09340 would be purely the main injection.
In the logs the IDE00472 has always been somewhat bigger than IDE09340.
IDE00472 vs. IDE09340 [mg/stroke]
16.07 vs. 14.00 (regen)​
18.20 vs. 15.83​
20.07 vs. 18.09​
18.83 vs. 16.28​
21.37 vs. 18.64​
18.82 vs. 16.31​
21.05 vs. 12.92 (regen)​
15.61 vs. 13.52​
20.79 vs. 18.16​
18.59 vs. 15.96​
20.28 vs. 17.64​
(20221114...20221122)

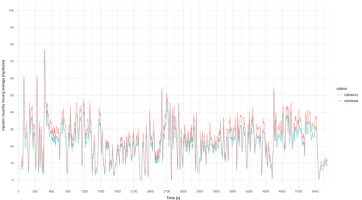
By a happy accident I happened to have both in the dataset

1693317283008.png

Definitely more deviation in IDE00472. Hard to compare quantities based on this plot though - but the hypothesis about IDE00472 summing all injections sounds very much possible.

The happy accident is really an accident - I've been fixing the dead / not useful pids from VW T6 Custom PID codes for DPF to my always on set and IDE09340 was one of the newly added ones, I just missed the point that IDE00472 was already there.

EDIT: by switching to time series plot and comparing moving averages of IDE09340 / IDE00472 it can be seen IDE09340 is indeed little bit lower

1693320967459.png
 
Last edited:
DSG Motion Resistance Index

CAN native data includes something called motion resistance index, sent by DSG. It's sent at 100Hz frequency and has a range from -31.623 to 31.623 and it has no unit. While there's no more accurate description of the signal, I think it's some kind of normalisation of the torque values DSG sees through clutches and probably a source into specifying how much torque DSG should request from engine.

Here's couple of plots depicting the motion resistance index against other variables. Motion resistance index really has a resolution of 0.25, so just plotting would result in vertical stripes. I've added some random jitter to the samples so that the density of sample placements is better revealed - the jitter is small enough to not affect sample clustering significantly.

First, DSG target engine torque. This is also sent by DSG and afaiu signals what the DSG would like to have from the engine. Requested torque seems to cluster most around 8-20% but quite often DSG just wants full power irrespective of motion resistance index.

TargetEngineTorqueByDSGResistanceIndex.png


Motion resistance index correlates quite strongly with vehicle pitch, no surprises here but this just confirms the index actually is affected by environment rather than just being calculated. Mental note: this data in relatively dry conditions, recheck in light / heavy rain or maybe tail / headwinds.

The lonely small cluster at the right is interesting. I can't immediately put my finger on what these moments would be - calls for a deeper look.

DSGMotionResistanceIndexByVehiclePitch.png

And finally, injection quantity also naturally correlates with motion resistance index. Again that strange lonely island on the right - from the first graph we see that DSG requests full power at that point but from here we see that engine does not respond by injecting more. Hmm.

MeanInjectionQuantityByDSGMotionResistanceIndex.png
 
Again that strange lonely island on the right - from the first graph we see that DSG requests full power at that point but from here we see that engine does not respond by injecting more. Hmm.

This is a case of reversing. We've all felt the sluggish reverse response. Now we have concrete evidence even DSG detects the resistance to motion and screams for more power but the silly ECU just refuses giving it :p
 
Based on a few logs I have thought IDE00472 Mean injection quantity could be sum of all injections (possibly excluding regen specifics), and IDE09340 would be purely the main injection.
In the logs the IDE00472 has always been somewhat bigger than IDE09340.

I think your thought on IDE00472 summing up all injections is spot on, including during regen.

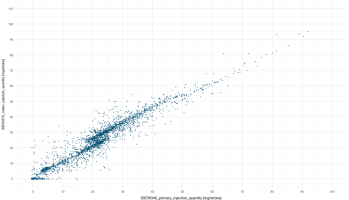
Here's comparisons of IDE00472 vs IDE09340 from similar size sample blocks from todays drive when regeneration was taking place and when it wasn't. IDE00472 is significantly higher than IDE09340 during regen - I think this can only be the case if a) regen is boosted by secondary injections and b) they are included in IDE00472.

The only thing that baffles me is the name 'mean' but perhaps it's just a mean across four cylinders.

No regen:

MeanVsPrimaryInjectionQuantityNoRegen.png

During regen:

MeanVsPrimaryInjectionQuantityDuringRegen.png
 
I think your thought on IDE00472 summing up all injections is spot on, including during regen.

Here's comparisons of IDE00472 vs IDE09340 from similar size sample blocks from todays drive when regeneration was taking place and when it wasn't. IDE00472 is significantly higher than IDE09340 during regen - I think this can only be the case if a) regen is boosted by secondary injections and b) they are included in IDE00472.
Thanks for checking that. Got curious and revisited my logs, and indeed calculating the fuel used by using the mean injection value the results are consistent with the other fuel consumption figure (IDE01407) which in turn is consistent will actual fill up amounts.

Obviously the data have a common source so not surprising they go hand in hand - unlike the fuel consumption figure on dash display, which seems to be derived from "IDE00371 Fuel consumption" to damp/mask DPF regen fuel consumption.
 
calculating the fuel used by using the mean injection value the results are consistent with the other fuel consumption figure (IDE01407)

How would you actually go about calculating consumption from injection quantity data?

I see getting from mg/stroke to volumetric unit such as millilitres would need at least fuel temperature to get density correction. Strokes we get from rpm or injection speed. But just feels the quantity sample rate will be too low on an engine under load, might work on an idling engine as the quantity is fairly stable?
 
How would you actually go about calculating consumption from injection quantity data?
Averaging RPM x time => number of strokes
Averaging injection quantity x strokes => fuel amount in grams
Just have been using average diesel density 830 g/l to get litres. I do recognize this possibly could be improved... but also density of diesel varies (e.g. summer/winter). Also the injection quantity is calculated value as there is no actual fuel metering capability in our engine.

Certainly there are uncertainties but I would guess also there are some also in ECUs internal calculation so fairly challenging to get exact match. Anyways, it has been quite satisfying to get different values to align with each others.
But just feels the quantity sample rate will be too low on an engine under load,
Not necessarily a problem I think. We do get fairly good sampling rate and I would expect the average would still be fairly accurate.

Specifically in these engines the value of IDE00472 (mean injection quantity) is coarse - full milligrams, no decimals as in IDE09340 (x.xx mg/str). Especially frustrating when engine is idling - just sits at 6 or 7 mg/str - so potentially some 15-20% error right there.
 
Back
Top